OPEN-SOURCE SCRIPT
Volume candle by Moond
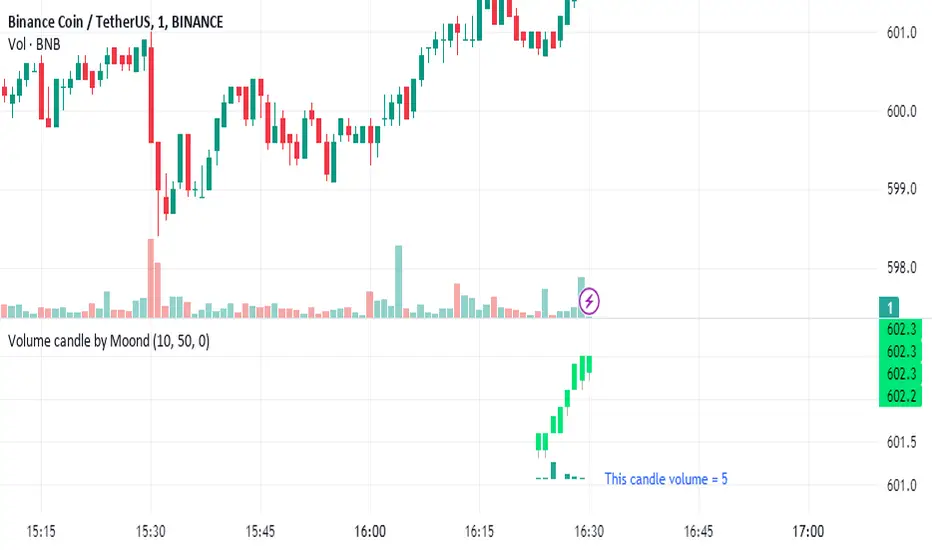
Indicator Description: Equal Volume Candle Chart
This indicator creates a real-time candlestick chart where each candle forms upon the completion of a specific volume threshold, rather than within fixed time intervals. The candles update dynamically based on the total volume traded, providing a unique perspective that incorporates market activity directly into price movements.
Key Features:
Dynamic Candles Based on Volume: Candles form when a defined lot size of volume is reached, making each candle represent consistent trading activity rather than a fixed time period.
Customizable Volume Lot Size: Users can easily adjust the volume threshold to suit different trading styles or asset classes.
Real-Time Market Reflection: The chart responds to changes in market volume, offering a clearer view of market intensity and momentum.
Concept Behind the Indicator: Traditional candlestick charts operate on time intervals, which can ignore the influence of volume in price changes. By basing the candle formation on equal volumes, this indicator integrates both price and traded volume into the visual representation, helping traders capture key shifts in market sentiment and activity that might be missed on time-based charts
Mã nguồn mở
Theo đúng tinh thần TradingView, tác giả của tập lệnh này đã công bố nó dưới dạng mã nguồn mở, để các nhà giao dịch có thể xem xét và xác minh chức năng. Chúc mừng tác giả! Mặc dù bạn có thể sử dụng miễn phí, hãy nhớ rằng việc công bố lại mã phải tuân theo Nội quy.
Thông báo miễn trừ trách nhiệm
Thông tin và các ấn phẩm này không nhằm mục đích, và không cấu thành, lời khuyên hoặc khuyến nghị về tài chính, đầu tư, giao dịch hay các loại khác do TradingView cung cấp hoặc xác nhận. Đọc thêm tại Điều khoản Sử dụng.