OPEN-SOURCE SCRIPT
💸 Monetary Momentum Oscillator (MMO)
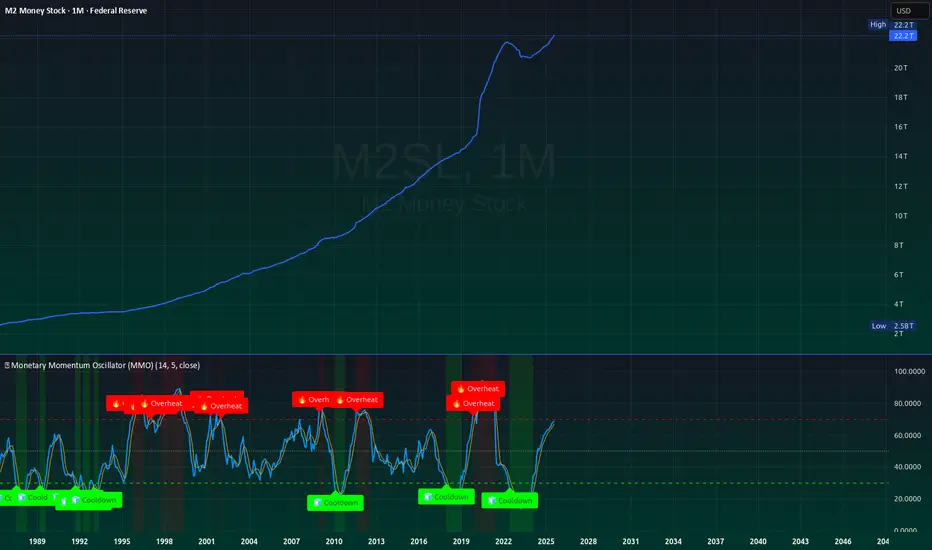
Monetary Momentum Oscillator (MMO)
The Monetary Momentum Oscillator (MMO) measures the rate of change in the money supply (like M2, Fed Balance Sheet, or similar macro series) and applies a momentum-based RSI calculation to visualize liquidity acceleration and deceleration.
💡 Purpose:
MMO is designed for macro-level analysis — it identifies when monetary expansion is overheating (potential inflation or risk-on conditions) and when contraction is cooling off (liquidity tightening or deflationary stress).
📊 How It Works:
Calculates the percentage change of the selected data source over a chosen lookback period.
Applies an RSI transformation to visualize momentum extremes.
Overlays signal smoothing and highlights overheat/cooldown zones.
🔍 Interpretation:
Above 70 → Liquidity acceleration / overheating (potential inflationary impulse).
Below 30 → Liquidity deceleration / contraction (risk-off, tightening).
Crossovers → Momentum shifts that often precede macro trend reversals in risk assets.
⚙️ Best Used On:
Macroeconomic series such as M2SL, M2V, WALCL, or custom liquidity indexes.
Long-term charts (weekly or monthly) for detecting major monetary regime transitions.
🧩 Core Idea:
Liquidity is the real market engine — this oscillator quantifies its pulse.
Mã nguồn mở
Theo đúng tinh thần TradingView, người tạo ra tập lệnh này đã biến tập lệnh thành mã nguồn mở để các nhà giao dịch có thể xem xét và xác minh công năng. Xin dành lời khen tặng cho tác giả! Mặc dù bạn có thể sử dụng miễn phí, nhưng lưu ý nếu đăng lại mã, bạn phải tuân theo Quy tắc nội bộ của chúng tôi.
Thông báo miễn trừ trách nhiệm
Thông tin và ấn phẩm không có nghĩa là và không cấu thành, tài chính, đầu tư, kinh doanh, hoặc các loại lời khuyên hoặc khuyến nghị khác được cung cấp hoặc xác nhận bởi TradingView. Đọc thêm trong Điều khoản sử dụng.