OPEN-SOURCE SCRIPT
Multi Asset Histogram [ChartPrime]
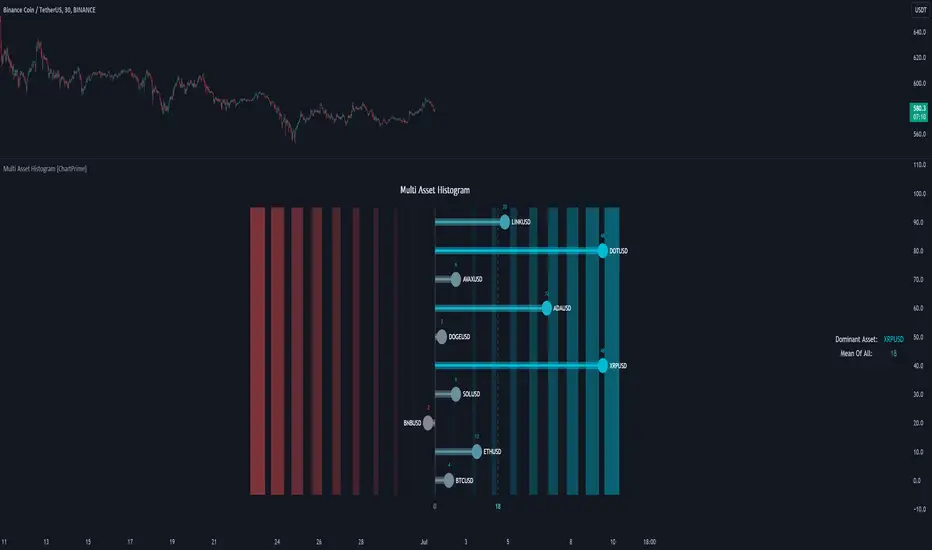
Multi Asset Histogram Indicator
Overview:
The "Multi Asset Histogram" indicator provides a comprehensive visualization of the performance of multiple assets relative to each other. By calculating a score for each asset and displaying it in a histogram format, this indicator helps traders quickly identify the trends, dominant asset and the average performance of the assets in the selected group.
Key Features:
◆ Multi-Asset Score Calculation:
The indicator calculates a trend score for each selected asset based on the price source (e.g., hl2).
The trend score is determined by comparing the current price to the prices over the past bars back defined by user, adding or subtracting points based on whether the current price is higher or lower than previous prices.
Pine Script®
◆ Flexible Symbol Input:
Traders can input up to 10 different symbols (e.g., BTCUSD, ETHUSD, etc.) to be included in the histogram analysis.

◆ Dynamic Visualization:
A histogram is plotted for each asset, with bars colored based on the score, providing a clear visual representation of the relative performance.
Color gradients from red to aqua indicate the performance, with red representing negative scores and aqua representing positive scores.
◆ Adaptive Histogram Lines:
The width and placement of histogram lines adapt based on the calculated scores, ensuring clear visualization regardless of the values.
Dashed lines represent the mean score of all assets, helping traders identify the overall market trend.
◆Detailed Labels and Values:
Labels are placed on the histogram to display the exact score for each asset.

Mean value and zero line labels provide additional context for the overall performance.

◆ Visual Scaling Lines:
Zero line and mean line are clearly marked, helping traders understand the distribution and scale of scores.
Scales on the left and right of the histogram indicate the performance range.

◆ Informative Table:
A table is displayed on the chart, showing the dominant asset (the one with the highest score) and the mean score of all assets.
The table updates dynamically to reflect real-time changes in asset performance.

◆ Settings:
Usage Notes:
This indicator is useful for traders who monitor multiple assets simultaneously and need a quick visual reference to identify the strongest and weakest performers.
The color coding and dynamic labels make it easy to interpret the relative performance and make informed trading decisions.
This indicator is designed to enhance multi-asset analysis by providing a clear, visual representation of each asset's performance relative to the others, making it easier to identify trends and dominant assets in the market.
Overview:
The "Multi Asset Histogram" indicator provides a comprehensive visualization of the performance of multiple assets relative to each other. By calculating a score for each asset and displaying it in a histogram format, this indicator helps traders quickly identify the trends, dominant asset and the average performance of the assets in the selected group.
Key Features:
◆ Multi-Asset Score Calculation:
The indicator calculates a trend score for each selected asset based on the price source (e.g., hl2).
The trend score is determined by comparing the current price to the prices over the past bars back defined by user, adding or subtracting points based on whether the current price is higher or lower than previous prices.
// Score Function
trscore(src) =>
total = 0.0
for i = 1 to 50
total += (src >= nz(src) ? 1 : -1)
total
◆ Flexible Symbol Input:
Traders can input up to 10 different symbols (e.g., BTCUSD, ETHUSD, etc.) to be included in the histogram analysis.
◆ Dynamic Visualization:
A histogram is plotted for each asset, with bars colored based on the score, providing a clear visual representation of the relative performance.
Color gradients from red to aqua indicate the performance, with red representing negative scores and aqua representing positive scores.
◆ Adaptive Histogram Lines:
The width and placement of histogram lines adapt based on the calculated scores, ensuring clear visualization regardless of the values.
Dashed lines represent the mean score of all assets, helping traders identify the overall market trend.
◆Detailed Labels and Values:
Labels are placed on the histogram to display the exact score for each asset.
Mean value and zero line labels provide additional context for the overall performance.
◆ Visual Scaling Lines:
Zero line and mean line are clearly marked, helping traders understand the distribution and scale of scores.
Scales on the left and right of the histogram indicate the performance range.
◆ Informative Table:
A table is displayed on the chart, showing the dominant asset (the one with the highest score) and the mean score of all assets.
The table updates dynamically to reflect real-time changes in asset performance.
◆ Settings:
- Length: The value of number bars back is greater or less than the current value of the source
- Source: The price source to be used for score calculation (e.g., hl2).
- Symbols: Up to 10 different asset symbols can be input for analysis.
Usage Notes:
This indicator is useful for traders who monitor multiple assets simultaneously and need a quick visual reference to identify the strongest and weakest performers.
The color coding and dynamic labels make it easy to interpret the relative performance and make informed trading decisions.
This indicator is designed to enhance multi-asset analysis by providing a clear, visual representation of each asset's performance relative to the others, making it easier to identify trends and dominant assets in the market.
Mã nguồn mở
Theo đúng tinh thần TradingView, tác giả của tập lệnh này đã công bố nó dưới dạng mã nguồn mở, để các nhà giao dịch có thể xem xét và xác minh chức năng. Chúc mừng tác giả! Mặc dù bạn có thể sử dụng miễn phí, hãy nhớ rằng việc công bố lại mã phải tuân theo Nội quy.
Thông báo miễn trừ trách nhiệm
Thông tin và các ấn phẩm này không nhằm mục đích, và không cấu thành, lời khuyên hoặc khuyến nghị về tài chính, đầu tư, giao dịch hay các loại khác do TradingView cung cấp hoặc xác nhận. Đọc thêm tại Điều khoản Sử dụng.