OPEN-SOURCE SCRIPT
Cập nhật Market Internals Dashboard (Table) v5 - Fixed

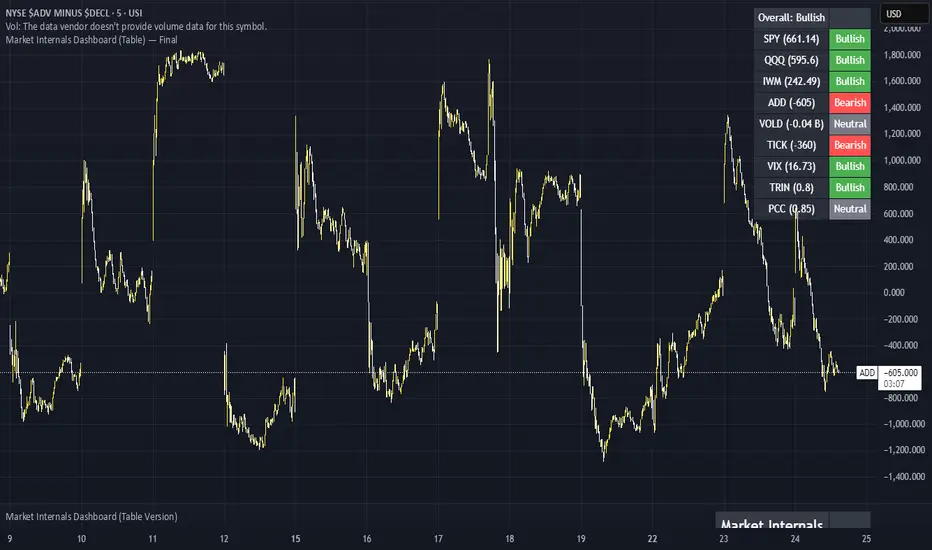
Has a Dashboard for Market Internals and 3 Indices, very helpful
Phát hành các Ghi chú
Here’s a breakdown for each category and the key thresholds traders watch:1.
> +1000 (NYSE): Strong upside participation → bias calls.
< –1000: Broad downside participation → bias puts.
Between –500 and +500 = choppy / indecision.
2.
Measures number of stocks upticking vs. downticking.
+800 or higher spikes → strong buying pressure.
–800 or lower spikes → strong selling pressure.
Constant readings above 0 = bullish tape.
Constant readings below 0 = bearish tape.
3.
Falling VIX intraday → risk-on, bias calls.
Rising VIX intraday → risk-off, bias puts.
<15 = complacency (strong bullish environment).
>20 = fear (bearish environment).
Watch directional change intraday, not just level.
4.
TRIN = advancing/declining volume ÷ advancing/declining issues.
<1.0 = bullish (volume favors advancers).
>1.0 = bearish (volume favors decliners).
Extreme <0.7 → very bullish, sometimes exhaustion.
Extreme >1.3–1.5 → very bearish, possible capitulation.
5. Put/Call Ratio (USI:PCC)
<0.8 = bullish sentiment (calls overweight puts).
>1.2 = bearish sentiment (puts overweight calls).
Middle ground (0.9–1.1) = neutral chop.
Note: Works best as a contrarian signal on extremes.
6. SPY, QQQ, IWM (Price vs. 20 SMA in our script)
Above 20 SMA = bullish bias.
Below 20 SMA = bearish bias.
Confirms what internals are saying.
How to Use Together
✅ Strong Call Setup:
ADD > +1000, TICK persistently > 0, TRIN < 1, VIX flat or falling, PCC < 0.8.
✅ Strong Put Setup:
ADD < –1000, TICK persistently < 0, TRIN > 1, VIX rising, PCC > 1.2.
⚠️ Neutral / Chop Zone:
ADD between –500 and +500, TICK flipping around 0, TRIN near 1, VIX flat → avoid trading until confirmation.
📈 How to Read VOLD (NYSE:VOLD)
Here are the key thresholds most pros use intraday:
VOLD Value Meaning Bias
+500M to +1B+ Strong upside volume – broad participation 📈 Call bias
+200M to +500M Moderate bullish volume 📈 Mild call bias
–200M to –500M Moderate bearish volume 📉 Mild put bias
–500M to –1B+ Strong downside volume – broad selling pressure 📉 Put bias
Near 0 Mixed or no conviction ⚠️ Chop zone – avoid trades
💡 Pro tip:
VOLD tends to trend all day once the session bias is set. If it’s above +500M early and rising, odds are the market closes bullish. Same for heavy negative VOLD.
Mã nguồn mở
Theo đúng tinh thần TradingView, tác giả của tập lệnh này đã công bố nó dưới dạng mã nguồn mở, để các nhà giao dịch có thể xem xét và xác minh chức năng. Chúc mừng tác giả! Mặc dù bạn có thể sử dụng miễn phí, hãy nhớ rằng việc công bố lại mã phải tuân theo Nội quy.
Thông báo miễn trừ trách nhiệm
Thông tin và các ấn phẩm này không nhằm mục đích, và không cấu thành, lời khuyên hoặc khuyến nghị về tài chính, đầu tư, giao dịch hay các loại khác do TradingView cung cấp hoặc xác nhận. Đọc thêm tại Điều khoản Sử dụng.