OPEN-SOURCE SCRIPT
Cập nhật Morning Break Out
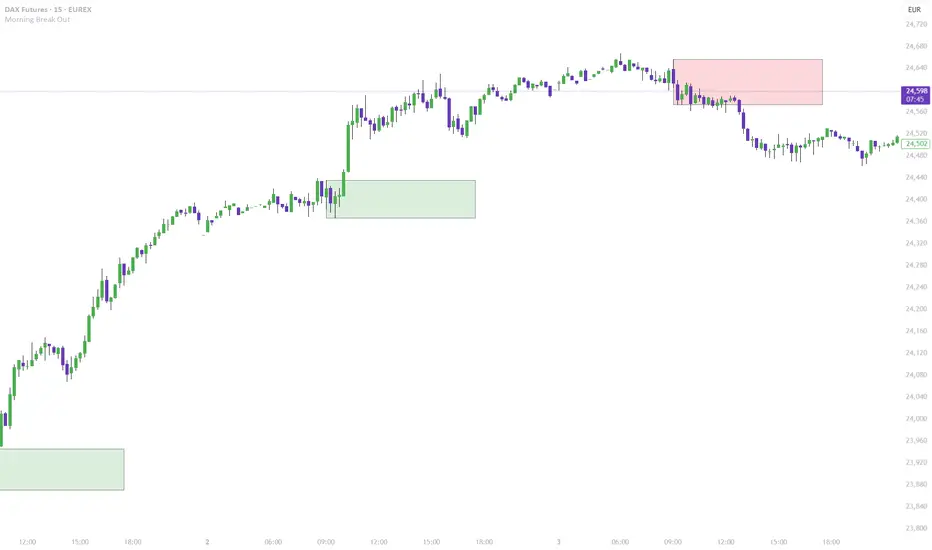
This indicator visualizes a classic morning breakout setup for the DAX and other European markets. The first hour often sets the tone for the trading day — this tool helps you identify that visually and react accordingly.
🔍 How It Works:
Box Range Calculation:
The high and low between 09:00 and 10:00 define the top and bottom of the box.
Color Logic:
Green: Price breaks above the box after 10:00 → bullish breakout
Red: Price breaks below the box after 10:00 → bearish breakout
Gray: No breakout → neutral phase
📈 Use Cases:
Identify breakout setups visually
Ideal for intraday traders and momentum strategies
Combine with volume or trend filters
⚙️ Notes:
Recommended for timeframes 1-minute and above
Uses the chart’s local timezone (e.g. CET/CEST for XETRA/DAX)
Works on all instruments with data before 09:00 — perfect for DAX, EuroStoxx, futures, FX, CFDs, etc.
Phát hành các Ghi chú
This indicator visualizes a classic morning breakout setup for the DAX and other European markets. The first hour often sets the tone for the trading day — this tool helps you identify that visually and react accordingly.🔍 How It Works:
Box Range Calculation:
The high and low between 09:00 and 10:00 define the top and bottom of the box.
Color Logic:
Green: Price breaks above the box after 10:00 → bullish breakout
Red: Price breaks below the box after 10:00 → bearish breakout
Gray: No breakout → neutral phase
📈 Use Cases:
Identify breakout setups visually
Ideal for intraday traders and momentum strategies
Combine with volume or trend filters
⚙️ Notes:
Recommended for timeframes 1-minute and above
Uses the chart’s local timezone (e.g. CET/CEST for XETRA/DAX)
Works on all instruments with data before 09:00 — perfect for DAX, EuroStoxx, futures, FX, CFDs, etc.
Mã nguồn mở
Theo đúng tinh thần TradingView, tác giả của tập lệnh này đã công bố nó dưới dạng mã nguồn mở, để các nhà giao dịch có thể xem xét và xác minh chức năng. Chúc mừng tác giả! Mặc dù bạn có thể sử dụng miễn phí, hãy nhớ rằng việc công bố lại mã phải tuân theo Nội quy.
Thông báo miễn trừ trách nhiệm
Thông tin và các ấn phẩm này không nhằm mục đích, và không cấu thành, lời khuyên hoặc khuyến nghị về tài chính, đầu tư, giao dịch hay các loại khác do TradingView cung cấp hoặc xác nhận. Đọc thêm tại Điều khoản Sử dụng.