OPEN-SOURCE SCRIPT
High Minus Low

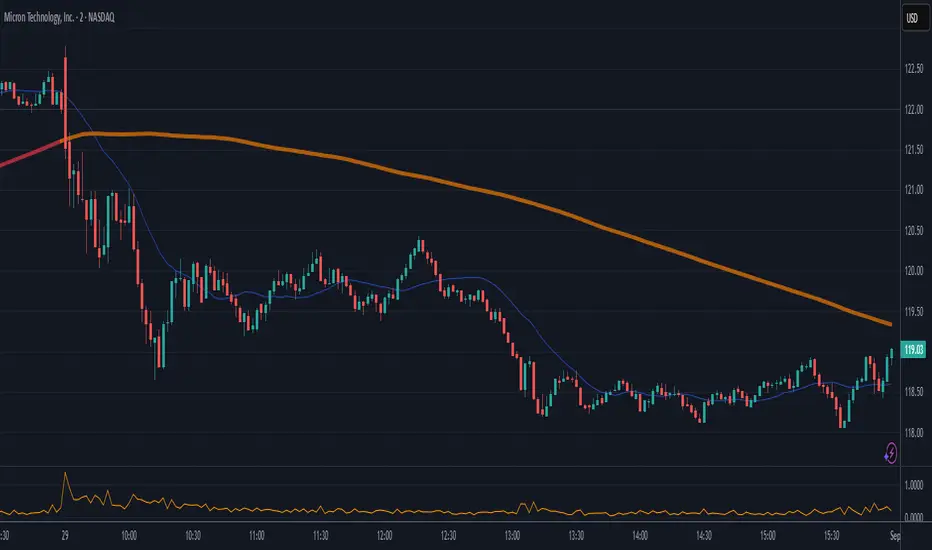
This indicator is a simple yet powerful tool for technical analysis. It measures the range of each candlestick by calculating the difference between its high and low, providing a direct visualization of market volatility.
Key Features:
Volatility at a Glance: The plot's height in the separate panel directly corresponds to the candle's trading range, allowing you to easily spot periods of high or low volatility.
Customizable Color: Easily change the line color to match your chart's theme and personal preferences.
Actionable Insights: Use this indicator to confirm periods of market consolidation before a breakout or to gauge the strength of a trend based on the expansion of candle ranges.
Mã nguồn mở
Theo đúng tinh thần TradingView, tác giả của tập lệnh này đã công bố nó dưới dạng mã nguồn mở, để các nhà giao dịch có thể xem xét và xác minh chức năng. Chúc mừng tác giả! Mặc dù bạn có thể sử dụng miễn phí, hãy nhớ rằng việc công bố lại mã phải tuân theo Nội quy.
Thông báo miễn trừ trách nhiệm
Thông tin và các ấn phẩm này không nhằm mục đích, và không cấu thành, lời khuyên hoặc khuyến nghị về tài chính, đầu tư, giao dịch hay các loại khác do TradingView cung cấp hoặc xác nhận. Đọc thêm tại Điều khoản Sử dụng.