OPEN-SOURCE SCRIPT
Cập nhật Traders Trend Dashboard
The Traders Trend Dashboard (TTD) is a comprehensive trend analysis tool designed to assist traders in making informed trading decisions across various markets and timeframes. Unlike conventional trend-following scripts, TTD goes beyond simple trend detection by incorporating a unique combination of moving averages and a visual dashboard, providing traders with a clear and actionable overview of market trends. Here's how TTD stands out from the crowd:
Originality and Uniqueness:
TTD doesn't rely on just one moving average crossover to detect trends. Instead, it employs a dynamic approach by comparing two moving averages of distinct periods across multiple timeframes. This innovative methodology enhances trend detection accuracy and reduces false signals commonly associated with single moving average systems.
Market Applicability:
TTD is versatile and adaptable to various financial markets, including forex, stocks, cryptocurrencies, and commodities. Its flexibility ensures that traders can utilize it across different asset classes and capitalize on market opportunities.
Optimal Timeframe Utilization:
Unlike many trend indicators that work best on specific timeframes, TTD caters to traders with diverse trading preferences. It offers support for intraday trading (1m, 3m, 5m), short-term trading (15m, 30m, 1h), and swing trading (4h, D, W, M), making it suitable for a wide range of trading styles.
Underlying Conditions and Interpretation:
TTD is particularly effective during trending markets, where its multi-timeframe approach helps identify consistent trends across various time horizons. In ranging markets, TTD can indicate potential reversals or areas of uncertainty when moving averages converge or cross frequently.
How to Use TTD:
1. Timeframe Selection: Choose the relevant timeframes based on your trading style and preferences. Enable or disable timeframes in the settings to focus on the most relevant ones for your strategy.
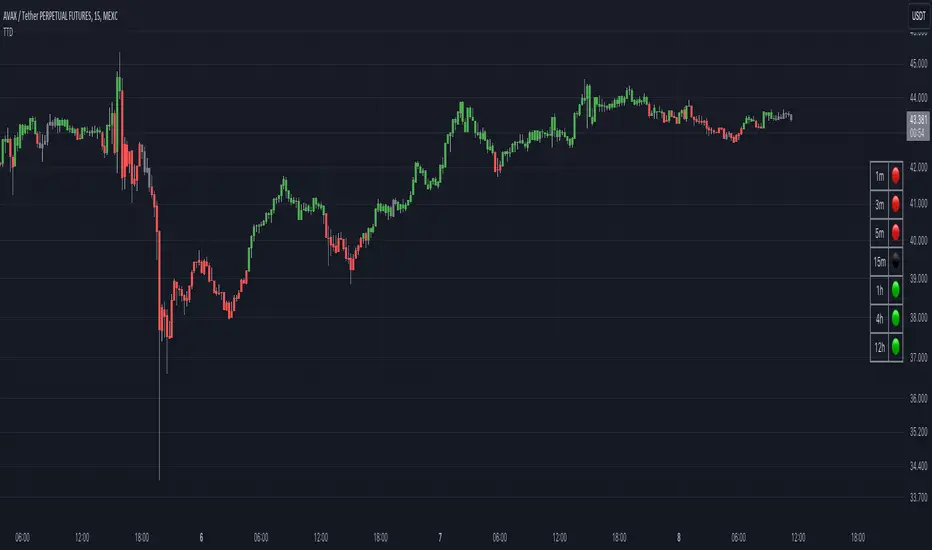
2. Dashboard Interpretation: The TTD dashboard displays green (🟢) and red (🔴) symbols to indicate the relationship between two moving averages. A green symbol suggests that the shorter moving average is above the longer one, indicating a potential bullish trend. A red symbol suggests the opposite, indicating a potential bearish trend.
3. Confirmation and Strategy: Consider TTD signals as confirmation for your trading strategy. For instance, in an uptrend, look for long opportunities when the dashboard displays consistent green symbols. Conversely, in a downtrend, focus on short opportunities when red symbols dominate.
4. Risk Management: As with any indicator, use TTD in conjunction with proper risk management techniques. Avoid trading solely based on indicator signals; instead, integrate them into a comprehensive trading plan.
Conclusion:
The Traders Trend Dashboard (TTD) offers traders a powerful edge in trend analysis, combining innovation, versatility, and clarity. By understanding its unique methodology and integrating its signals with your trading strategy, you can make more informed trading decisions across various markets and timeframes. Elevate your trading with TTD and unlock a new level of trend analysis precision.
Originality and Uniqueness:
TTD doesn't rely on just one moving average crossover to detect trends. Instead, it employs a dynamic approach by comparing two moving averages of distinct periods across multiple timeframes. This innovative methodology enhances trend detection accuracy and reduces false signals commonly associated with single moving average systems.
Market Applicability:
TTD is versatile and adaptable to various financial markets, including forex, stocks, cryptocurrencies, and commodities. Its flexibility ensures that traders can utilize it across different asset classes and capitalize on market opportunities.
Optimal Timeframe Utilization:
Unlike many trend indicators that work best on specific timeframes, TTD caters to traders with diverse trading preferences. It offers support for intraday trading (1m, 3m, 5m), short-term trading (15m, 30m, 1h), and swing trading (4h, D, W, M), making it suitable for a wide range of trading styles.
Underlying Conditions and Interpretation:
TTD is particularly effective during trending markets, where its multi-timeframe approach helps identify consistent trends across various time horizons. In ranging markets, TTD can indicate potential reversals or areas of uncertainty when moving averages converge or cross frequently.
How to Use TTD:
1. Timeframe Selection: Choose the relevant timeframes based on your trading style and preferences. Enable or disable timeframes in the settings to focus on the most relevant ones for your strategy.
2. Dashboard Interpretation: The TTD dashboard displays green (🟢) and red (🔴) symbols to indicate the relationship between two moving averages. A green symbol suggests that the shorter moving average is above the longer one, indicating a potential bullish trend. A red symbol suggests the opposite, indicating a potential bearish trend.
3. Confirmation and Strategy: Consider TTD signals as confirmation for your trading strategy. For instance, in an uptrend, look for long opportunities when the dashboard displays consistent green symbols. Conversely, in a downtrend, focus on short opportunities when red symbols dominate.
4. Risk Management: As with any indicator, use TTD in conjunction with proper risk management techniques. Avoid trading solely based on indicator signals; instead, integrate them into a comprehensive trading plan.
Conclusion:
The Traders Trend Dashboard (TTD) offers traders a powerful edge in trend analysis, combining innovation, versatility, and clarity. By understanding its unique methodology and integrating its signals with your trading strategy, you can make more informed trading decisions across various markets and timeframes. Elevate your trading with TTD and unlock a new level of trend analysis precision.
Phát hành các Ghi chú
- Enhanced Customization: You can now customize the appearance of uptrend and downtrend indicators to better suit your trading preferences.
- Improved Setting Names: We've renamed certain settings to make them more intuitive and user-friendly, making it easier to configure the dashboard according to your needs.
- Dashboard Appearance Fix: We've resolved an issue related to the dashboard's appearance when using the "large" size option, ensuring a smoother and more visually appealing experience.
- General Refactoring: We've conducted general code refactoring to improve the script's efficiency and maintainability, resulting in a more streamlined and optimized performance.
Phát hành các Ghi chú
Added more timeframes to the dashboardPhát hành các Ghi chú
- Updated the logic of trend identification. Now, instead of comparing fast and slow MAs, we compare an EMA value of the current and the previous candle (50 EMA by default) - Added a neutral trend indicator
- Removed 3M, 6M and 12M timeframes
Phát hành các Ghi chú
From now on, the neutral trend indicator also determines if there is no impulse. Think twice before opening orders when ⚫️ appears, because the next couple of candles may unpleasantly surprise you.Phát hành các Ghi chú
New alerts are now available to detect changes in trend and trend alignment on multiple timeframes ⏰Phát hành các Ghi chú
Fixed an issue where the dashboard was showing misleading information for closed markets.Phát hành các Ghi chú
Provided an option to choose a Trend Identification Approach 🛠️Phát hành các Ghi chú
Update the alert conditions ⏰Phát hành các Ghi chú
Added 12H timeframe at the request of the community 🙌Phát hành các Ghi chú
Added an option to paint the bars 🎨Phát hành các Ghi chú
Add an option to name the table 📝Phát hành các Ghi chú
Fix the dashboard header shift 🛠️Phát hành các Ghi chú
Added 2m timeframe at the request of the community 🙌Phát hành các Ghi chú
Fix 2m indicator 🛠️Phát hành các Ghi chú
Just a little refactoring 🛠️Phát hành các Ghi chú
Update spelling 🪄Phát hành các Ghi chú
Added 3D timeframe at the request of the community 🙌Phát hành các Ghi chú
- Add a new column with an EMA- Update dashboard title strings
- Remove unused timeframes
Phát hành các Ghi chú
Allow to update the background colour of table cells 🎨Phát hành các Ghi chú
🏎️ Improved performance: Optimized the indicator’s calculations for faster loading and smoother experience.🐛 Bug fix: Resolved an issue where the indicator did not display on instruments that don’t support intraday timeframes.
Phát hành các Ghi chú
🛠️ Revert the change related to intraday timeframes. Turned out it's a limitation of TradingView that cannot be bypassed, and my workaround broke the intraday on some other funds, such as leveraged assets.Phát hành các Ghi chú
🤌 Reduce an additional EMA minimum valuePhát hành các Ghi chú
🎉 Bump Pinescript versionPhát hành các Ghi chú
🙌 Added 6H and 8H timeframes at the request of the communityMã nguồn mở
Theo đúng tinh thần TradingView, tác giả của tập lệnh này đã công bố nó dưới dạng mã nguồn mở, để các nhà giao dịch có thể xem xét và xác minh chức năng. Chúc mừng tác giả! Mặc dù bạn có thể sử dụng miễn phí, hãy nhớ rằng việc công bố lại mã phải tuân theo Nội quy.
Thông báo miễn trừ trách nhiệm
Thông tin và các ấn phẩm này không nhằm mục đích, và không cấu thành, lời khuyên hoặc khuyến nghị về tài chính, đầu tư, giao dịch hay các loại khác do TradingView cung cấp hoặc xác nhận. Đọc thêm tại Điều khoản Sử dụng.
Mã nguồn mở
Theo đúng tinh thần TradingView, tác giả của tập lệnh này đã công bố nó dưới dạng mã nguồn mở, để các nhà giao dịch có thể xem xét và xác minh chức năng. Chúc mừng tác giả! Mặc dù bạn có thể sử dụng miễn phí, hãy nhớ rằng việc công bố lại mã phải tuân theo Nội quy.
Thông báo miễn trừ trách nhiệm
Thông tin và các ấn phẩm này không nhằm mục đích, và không cấu thành, lời khuyên hoặc khuyến nghị về tài chính, đầu tư, giao dịch hay các loại khác do TradingView cung cấp hoặc xác nhận. Đọc thêm tại Điều khoản Sử dụng.