OPEN-SOURCE SCRIPT
Cập nhật Correlation Coefficient Colored Candles
This script utilizes Tradingview's built in Correlation Coefficient indicator to calculate the correlation coefficient between two assets and changes candle colors based on the related data.
Info From Correlation Coefficient Indicator:
Correlation Coefficient (CC) is used in statistics to measure the correlation between two sets of data. In the trading world, the data sets would be stocks, etf's or any other financial instrument. The correlation between two financial instruments, simply put, is the degree in which they are related. Correlation is based on a scale of 1 to -1. The closer the Correlation Coefficient is to 1, the higher their positive correlation. The instruments will move up and down together. The higher the Correlation efficient is to -1, the more they move in opposite directions. A value at 0 indicates that there is no correlation.
This indicator allows for choosing the correlated asset, between direct and inverse correlation, the length of the series, and the correlation factor that will trigger the candles to change colors.
Example 1: You choose Direct correlation with a factor of 0.75, the candles that fall below that correlation factor will paint in your desired colors based on their closing price (up or down).
Example 2: You choose Inverse correlation with a factor of -0.75, the candles that rise above that correlation factor will paint in your desired colors based on their closing price (up or down).
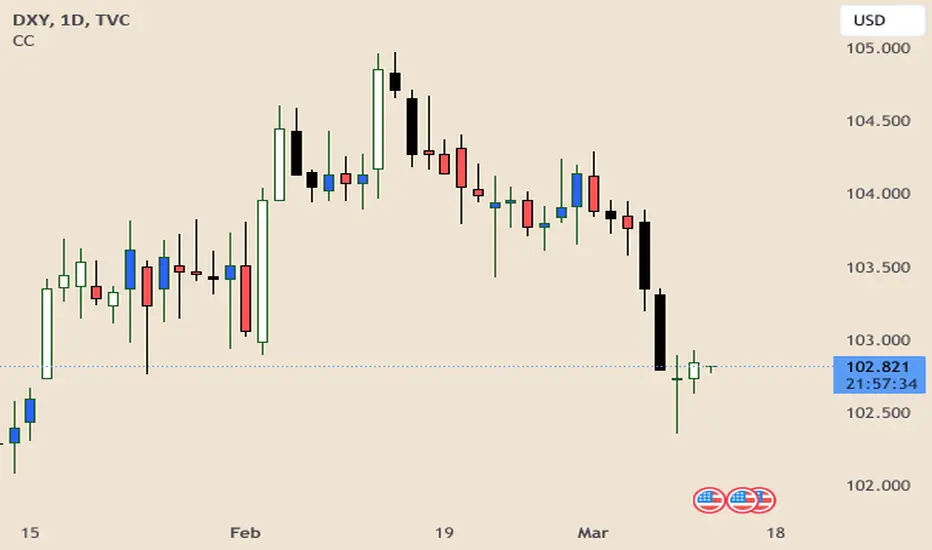
Chart Shows Direct correlation of DXY and US10Y with length 3 and correlation factor of 0.75
Info From Correlation Coefficient Indicator:
Correlation Coefficient (CC) is used in statistics to measure the correlation between two sets of data. In the trading world, the data sets would be stocks, etf's or any other financial instrument. The correlation between two financial instruments, simply put, is the degree in which they are related. Correlation is based on a scale of 1 to -1. The closer the Correlation Coefficient is to 1, the higher their positive correlation. The instruments will move up and down together. The higher the Correlation efficient is to -1, the more they move in opposite directions. A value at 0 indicates that there is no correlation.
This indicator allows for choosing the correlated asset, between direct and inverse correlation, the length of the series, and the correlation factor that will trigger the candles to change colors.
Example 1: You choose Direct correlation with a factor of 0.75, the candles that fall below that correlation factor will paint in your desired colors based on their closing price (up or down).
Example 2: You choose Inverse correlation with a factor of -0.75, the candles that rise above that correlation factor will paint in your desired colors based on their closing price (up or down).
Chart Shows Direct correlation of DXY and US10Y with length 3 and correlation factor of 0.75
Phát hành các Ghi chú
Updated to set min and max values for correlation factor, and added a step value.*** Example 3: NQ and DXY, Inverse Correlation, Factor 0.5. Candles will color when NQ price movement is correlated with DXY; instead of being inverse.
Length
The time period to be used in calculating the correlation.
Mã nguồn mở
Theo đúng tinh thần TradingView, tác giả của tập lệnh này đã công bố nó dưới dạng mã nguồn mở, để các nhà giao dịch có thể xem xét và xác minh chức năng. Chúc mừng tác giả! Mặc dù bạn có thể sử dụng miễn phí, hãy nhớ rằng việc công bố lại mã phải tuân theo Nội quy.
Thông báo miễn trừ trách nhiệm
Thông tin và các ấn phẩm này không nhằm mục đích, và không cấu thành, lời khuyên hoặc khuyến nghị về tài chính, đầu tư, giao dịch hay các loại khác do TradingView cung cấp hoặc xác nhận. Đọc thêm tại Điều khoản Sử dụng.