OPEN-SOURCE SCRIPT
Cập nhật BUY in HASH Ribbons
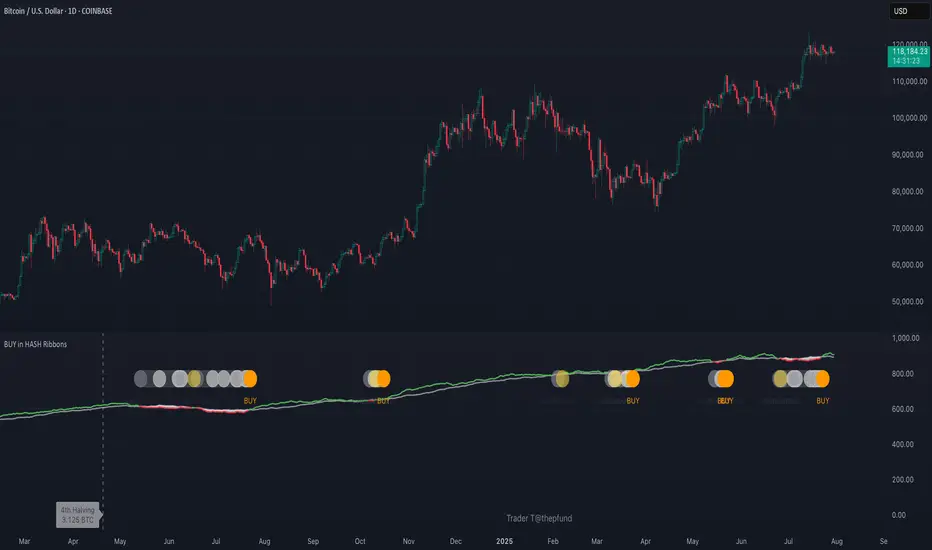
Hash Ribbons Indicator (BUY Signal)
A TradingView Pine Script v6 implementation for identifying Bitcoin miner capitulation (“Springs”) and recovery phases based on hash rate data. It marks potential low-risk buying opportunities by tracking short- and long-term moving averages of the network hash rate.
⸻
Key Features
• Hash Rate SMAs
• Short-term SMA (default: 30 days)
• Long-term SMA (default: 60 days)
• Phase Markers
• Gray circle: Short SMA crosses below long SMA (start of capitulation)
• White circles: Ongoing capitulation, with brighter white when the short SMA turns upward
• Yellow circle: Short SMA crosses back above long SMA (end of capitulation)
• Orange circle: Buy signal once hash rate recovery aligns with bullish price momentum (10-day price SMA crosses above 20-day price SMA)
• Display Modes
• Ribbons: Plots the two SMAs as colored bands—red for capitulation, green for recovery
• Oscillator: Shows the percentage difference between SMAs as a histogram (red for negative, blue for positive)
• Optional Overlays
• Bitcoin halving dates (2012, 2016, 2020, 2024) with dashed lines and labels
• Raw hash rate data in EH/s
• Alerts
• Configurable alerts for capitulation start, recovery, and buy signals
⸻
How It Works
1. Data Source: Fetches daily hash rate values from a selected provider (e.g., IntoTheBlock, Quandl).
2. Capitulation Detection: When the 30-day SMA falls below the 60-day SMA, miners are likely capitulating.
3. Recovery Identification: A rising 30-day SMA during capitulation signals miner recovery.
4. Buy Signal: Confirmed when the hash rate recovery coincides with a bullish shift in price momentum (10-day price SMA > 20-day price SMA).
⸻
Inputs
Hash Rate Short SMA: 30 days
Hash Rate Long SMA: 60 days
Plot Signals: On
Plot Halvings: Off
Plot Raw Hash Rate: Off
⸻
Considerations
• Timeframe: Best applied on daily charts to capture meaningful miner behavior.
• Data Reliability: Ensure the chosen hash rate source provides consistent, gap-free data.
• Risk Management: Use alongside other technical indicators (e.g., RSI, MACD) and fundamental analysis.
• Backtesting: Evaluate performance over different market cycles before live deployment.
Phát hành các Ghi chú
Code optimized;HR Source updated.
Mã nguồn mở
Theo đúng tinh thần TradingView, tác giả của tập lệnh này đã công bố nó dưới dạng mã nguồn mở, để các nhà giao dịch có thể xem xét và xác minh chức năng. Chúc mừng tác giả! Mặc dù bạn có thể sử dụng miễn phí, hãy nhớ rằng việc công bố lại mã phải tuân theo Nội quy.
Thông báo miễn trừ trách nhiệm
Thông tin và các ấn phẩm này không nhằm mục đích, và không cấu thành, lời khuyên hoặc khuyến nghị về tài chính, đầu tư, giao dịch hay các loại khác do TradingView cung cấp hoặc xác nhận. Đọc thêm tại Điều khoản Sử dụng.