OPEN-SOURCE SCRIPT
Cập nhật Days Above ATH Z-Score
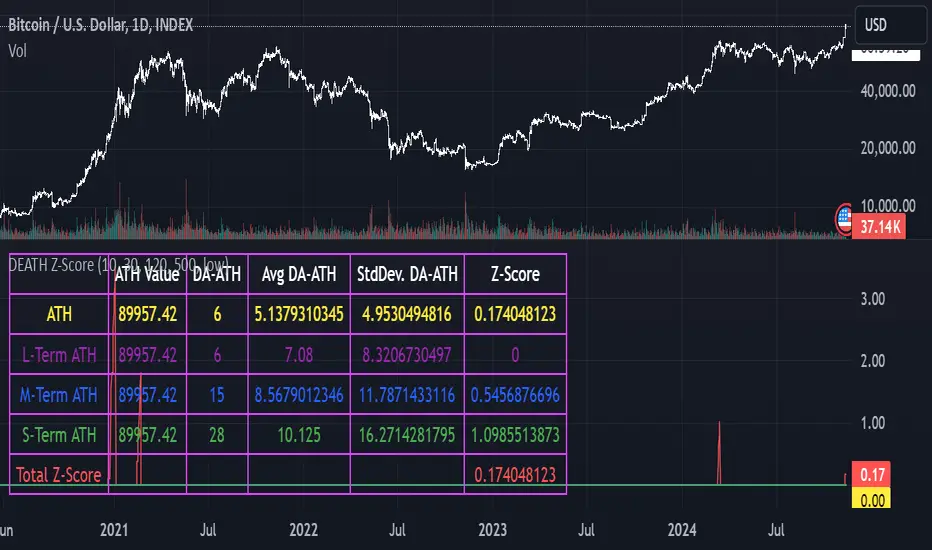
This indicator calculates the average number of days that the price is above its last ATH before suffering a significant dump. Then, it uses the average and the standard deviation to calculate the current Z-Score when breaking an ATH.
How to use it?
- You can customize the acceptable percentage drawdown in price before calling the streak broken. 10% gives a good signal.
- You can decide to plot 4 different time periods of price highs. By default they are 1 month back, 3 months back, 500 days back and then the absolute ATH. The time period is customizable.
- Besides plotting you can also decide whether to include a certain time period statistics to the overall Z-Score, which is the average of the selected Z-Scores. By default the indicator only uses the All-Times-High to calculate the Z Score of the Days Above it.
- The table displays all relevant stats by colors which correspond to the plots.
Provided signal:
- It can be a good tool to identify good selling opportunities in local tops.
- During the last local top (March 14th) it marked a Z-Score slightly above 2 exactly at the top before BTC started dumping.
- This script is supposed to get more accurate overtime as we break new ATHs. Therefore, I would not pay attention to Z-Scores before this (2024-2025) and the last bull run.
- I included 4 different customizable lookback periods for the calculations, you can enable or disable them as you please (I recommend using only one at once but you can experiment with it). All 4 Z-Scores get averaged in the final signal.
- The default value for the price drop threshold is 10% as it gave me a good signal along with the source for the drop being the Low of each candle. It is worth noticing that when the source is changed to Close for example, the threshold should be lowered to adjust for the volatility reduction by changing it from Low to Close
- This is not meant to be financial advice.
Phát hành các Ghi chú
- Updated to include a summary table and added customizable inputs- Now plots the Days Above ATH along with the Z-Score
Phát hành các Ghi chú
Fixed bug making >10% positive moves to count as a 10% drop causing the counter to restart.Phát hành các Ghi chú
Make the step to change the percent drawdown to be 0.1Mã nguồn mở
Theo đúng tinh thần TradingView, tác giả của tập lệnh này đã công bố nó dưới dạng mã nguồn mở, để các nhà giao dịch có thể xem xét và xác minh chức năng. Chúc mừng tác giả! Mặc dù bạn có thể sử dụng miễn phí, hãy nhớ rằng việc công bố lại mã phải tuân theo Nội quy.
Thông báo miễn trừ trách nhiệm
Thông tin và các ấn phẩm này không nhằm mục đích, và không cấu thành, lời khuyên hoặc khuyến nghị về tài chính, đầu tư, giao dịch hay các loại khác do TradingView cung cấp hoặc xác nhận. Đọc thêm tại Điều khoản Sử dụng.
Mã nguồn mở
Theo đúng tinh thần TradingView, tác giả của tập lệnh này đã công bố nó dưới dạng mã nguồn mở, để các nhà giao dịch có thể xem xét và xác minh chức năng. Chúc mừng tác giả! Mặc dù bạn có thể sử dụng miễn phí, hãy nhớ rằng việc công bố lại mã phải tuân theo Nội quy.
Thông báo miễn trừ trách nhiệm
Thông tin và các ấn phẩm này không nhằm mục đích, và không cấu thành, lời khuyên hoặc khuyến nghị về tài chính, đầu tư, giao dịch hay các loại khác do TradingView cung cấp hoặc xác nhận. Đọc thêm tại Điều khoản Sử dụng.