OPEN-SOURCE SCRIPT
Rate of Change of OBV with RSI Color
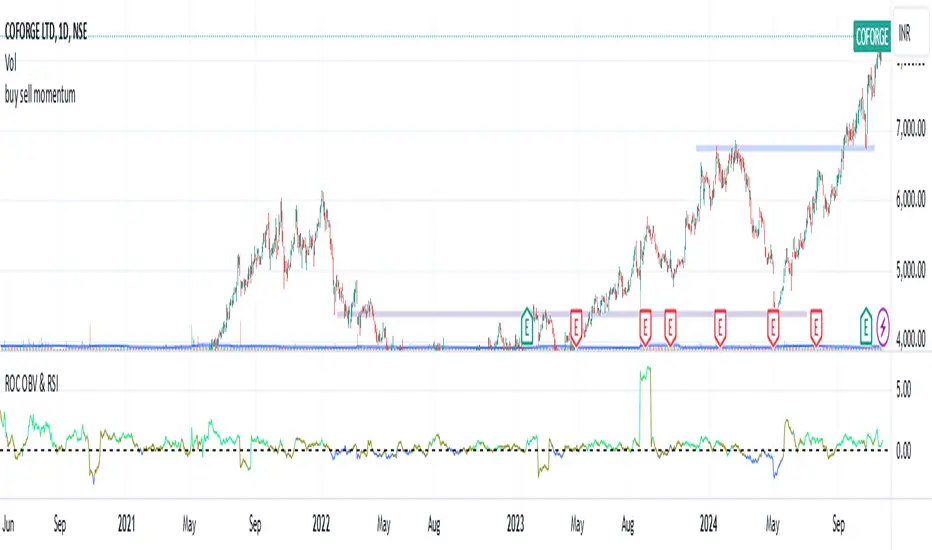
This indicator combines three popular tools in technical analysis: On-Balance Volume (OBV), Rate of Change (ROC), and Relative Strength Index (RSI). It aims to monitor momentum and potential trend reversals based on volume and price changes.
Calculation:
ROC(OBV) = ((OBV(today) - OBV(today - period)) / OBV(today - period)) * 100
This calculates the percentage change in OBV over a specific period. A positive ROC indicates an upward trend in volume, while a negative ROC suggests a downward trend.
What it Monitors:
OBV: Tracks the volume flow associated with price movements. Rising OBV suggests buying pressure, while falling OBV suggests selling pressure.
ROC of OBV:
Measures the rate of change in the OBV, indicating if the volume flow is accelerating or decelerating.
RSI: Measures the strength of recent price movements, indicating potential overbought or oversold conditions.
How it can be Used:
Identifying Trend Continuation: Rising ROC OBV with a rising RSI might suggest a continuation of an uptrend, especially if the color is lime (RSI above 60).
Identifying Trend Reversal: Falling ROC OBV with a declining RSI might suggest a potential trend reversal, especially if the color approaches blue (RSI below 40).
Confirmation with Threshold: The horizontal line (threshold) can be used as a support or resistance level. Bouncing ROC OBV off the threshold with a color change could suggest a pause in the trend but not necessarily a reversal.
When this Indicator is Useful:
This indicator can be useful for assets with strong volume activity, where tracking volume changes provides additional insights.
It might be helpful during periods of consolidation or trend continuation to identify potential breakouts or confirmations.
Mã nguồn mở
Theo đúng tinh thần TradingView, tác giả của tập lệnh này đã công bố nó dưới dạng mã nguồn mở, để các nhà giao dịch có thể xem xét và xác minh chức năng. Chúc mừng tác giả! Mặc dù bạn có thể sử dụng miễn phí, hãy nhớ rằng việc công bố lại mã phải tuân theo Nội quy.
Thông báo miễn trừ trách nhiệm
Thông tin và các ấn phẩm này không nhằm mục đích, và không cấu thành, lời khuyên hoặc khuyến nghị về tài chính, đầu tư, giao dịch hay các loại khác do TradingView cung cấp hoặc xác nhận. Đọc thêm tại Điều khoản Sử dụng.