OPEN-SOURCE SCRIPT
Cập nhật Donchian Forecast
Donchian Forecast – multi-timeframe Donchian/ATR bias with ADX regime blending
Donchian Forecast is a multi-timeframe bias tool that turns classic Donchian channels into a normalized trend/mean-reversion “forecast” and a single bias value in [-100%, +100%].
It projects a short polyline path from the current price and shows how that path adapts when the market shifts from ranging to trending (via ADX).
---
Concept
1. Donchian position → direction
For each timeframe, the script measures where price sits inside its Donchian channel:
-1 = near channel low
0 = middle
+1 = near channel high
This Donchian position is multiplied by ATR to create a **price delta** (how far the forecast moves from current price).
2. Local behavior: trend vs mean-reversion around Donchian
The indicator treats the edges vs middle of the Donchian channel differently:
* By default, edges behave more “trend-like”, middle more “mean-reverting”.
* If you enable the reversed option, this logic flips (edges = mean-reverting, middle = trend-
like).
* This “local” behavior is controlled smoothly by the absolute Donchian position |pos| (not by hard zone switches).
3. Global ADX modulation (regime aware)
ADX is mapped from your chosen low → high thresholds into a signed factor in [-1, +1]:
* ADX ≤ low → -1 (fully reversed behavior, more range/mean-reversion oriented)
* ADX ≥ high → +1 (fully normal behavior, more trend oriented)
* Values in between create a **smooth transition**.
* This global factor can:
* Keep the local behavior as is (trending regime),
* Flip it (range regime), or
* Neutralize it (indecisive regime).
4. Multi-timeframe aggregation (1x–12x chart timeframe)
* The script repeats the same logic across 12 horizons:
* 1x = chart timeframe
* 2x..12x = multiples of the chart timeframe (e.g., 5m → 10m, 15m, …; 1h → 2h, 3h, …).
* For each horizon it builds:
* Donchian position
* ATR-scaled delta (in price units)
* Locally + globally blended delta (after Donchian + ADX logic).
* These blended deltas are ATR-weighted and summed into a single bias in [-1, +1], which is then shown as Bias % in the on-chart table.
---
### What you see on the chart
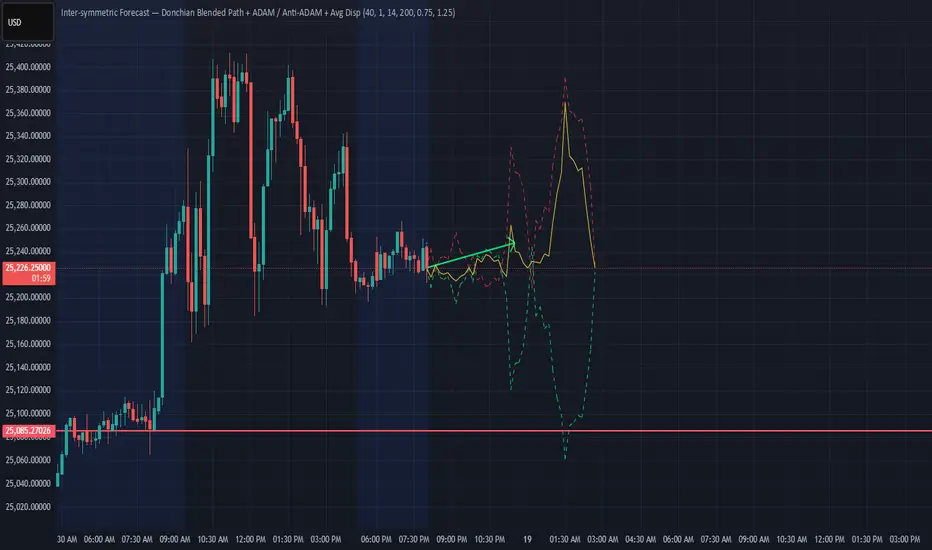
* Forecast polyline
* Starting at the current close, the indicator draws a short chain of **up to 12 segments**:
* Segment 1: from current price → 1x projection
* Segment 2: 1x → 2x projection
* … up to 12x.
* Each segment is:
* Green when its blended delta is ≥ 0 (upward bias)
* Red when its blended delta is < 0 (downward bias)
* This is not future price, but a synthetic path showing how the Donchian/ATR/ADX model “expects” price to drift across multiple horizons.
* Bias table (top-center)
* `Bias: X.Y%`
* > 0% (green) → net upward bias across horizons
* < 0% (red) → net downward bias
* Magnitude (e.g., ±70–100%) ≈ strength of the directional skew.
* `ADX:` current ADX value (from your DMI settings).
* `ADXBlend:` the signed ADX factor in [-1, +1]:
* +1 ≈ fully “trend-interpretation” of Donchian behavior
* 0 ≈ neutral / mixed regime
* -1 ≈ fully “reversed/mean-reversion interpretation”
---
Inputs & settings
Core Donchian / ATR
* Donchian Length – lookback for Donchian high/low on each horizon.
* Price Source – input series used for position inside the Donchian channel (default: close).
* ATR Length – ATR lookback for all horizons.
* ATR Multiplier – scales the size of each forecast step in price units (higher = longer segments / more aggressive forecast).
*Local behavior at high ADX
* Reversed local blend at high ADX?
* Off (default) – edges behave more trend-like, middle more mean-reverting.
* On – flips that logic (edges more mean-reverting, middle more trend-like).
* The actual effect is always modulated by the global ADX factor, so you can experiment with how the regime logic feels in different markets.
Global ADX blending
* DMI DI Length – period for the DI+ and DI- components.
* ADX Smoothing – smoothing length for ADX.
* ADX low (mean-rev zone) – below this level, the global factor pushes behavior toward reversal/range logic .
* ADX high (trend zone) – above this level, the global factor pushes behavior toward **trend logic**.
* Values between low and high create a smooth blend rather than a hard on/off switch.
---
How to use it (examples)
* Directional bias dashboard
* Use the Bias % as a compact summary of multi-horizon Donchian/ATR/ADX conditions:
* Consider only trades aligned with the sign of Bias (e.g., longs only when Bias > 0).
* Use the magnitude to filter for **strong vs weak** directional contexts.
* Regime-aware context
* Watch ADX and ADXBlend:
* High ADX & ADXBlend ≈ +1 → favor trend-continuation ideas.
* Low ADX & ADXBlend ≈ -1 → favor range/mean-reversion ideas.
* Around 0 → mixed/transition regimes; forecasts will be more muted.
* Visual sanity check for systems
* Overlay Donchian Forecast on your usual entries/exits to see:
* When your system trades **with** the multi-TF Donchian bias.
* When it trades **against** it (possible fade setups or no-trade zones).
This script does not generate entry or exit signals by itself. It is a contextual/forecast tool meant to sit on top of your own trading logic.
---
Notes
* Works on most symbols and timeframes; higher-timeframe multiples are built from the chart timeframe.
* The forecast line is a model-based projection, not a prediction or guarantee of future price.
* Always combine this with your own risk management, testing, and judgement. This is for educational and analytical purposes only and is not financial advice.
Donchian Forecast is a multi-timeframe bias tool that turns classic Donchian channels into a normalized trend/mean-reversion “forecast” and a single bias value in [-100%, +100%].
It projects a short polyline path from the current price and shows how that path adapts when the market shifts from ranging to trending (via ADX).
---
Concept
1. Donchian position → direction
For each timeframe, the script measures where price sits inside its Donchian channel:
-1 = near channel low
0 = middle
+1 = near channel high
This Donchian position is multiplied by ATR to create a **price delta** (how far the forecast moves from current price).
2. Local behavior: trend vs mean-reversion around Donchian
The indicator treats the edges vs middle of the Donchian channel differently:
* By default, edges behave more “trend-like”, middle more “mean-reverting”.
* If you enable the reversed option, this logic flips (edges = mean-reverting, middle = trend-
like).
* This “local” behavior is controlled smoothly by the absolute Donchian position |pos| (not by hard zone switches).
3. Global ADX modulation (regime aware)
ADX is mapped from your chosen low → high thresholds into a signed factor in [-1, +1]:
* ADX ≤ low → -1 (fully reversed behavior, more range/mean-reversion oriented)
* ADX ≥ high → +1 (fully normal behavior, more trend oriented)
* Values in between create a **smooth transition**.
* This global factor can:
* Keep the local behavior as is (trending regime),
* Flip it (range regime), or
* Neutralize it (indecisive regime).
4. Multi-timeframe aggregation (1x–12x chart timeframe)
* The script repeats the same logic across 12 horizons:
* 1x = chart timeframe
* 2x..12x = multiples of the chart timeframe (e.g., 5m → 10m, 15m, …; 1h → 2h, 3h, …).
* For each horizon it builds:
* Donchian position
* ATR-scaled delta (in price units)
* Locally + globally blended delta (after Donchian + ADX logic).
* These blended deltas are ATR-weighted and summed into a single bias in [-1, +1], which is then shown as Bias % in the on-chart table.
---
### What you see on the chart
* Forecast polyline
* Starting at the current close, the indicator draws a short chain of **up to 12 segments**:
* Segment 1: from current price → 1x projection
* Segment 2: 1x → 2x projection
* … up to 12x.
* Each segment is:
* Green when its blended delta is ≥ 0 (upward bias)
* Red when its blended delta is < 0 (downward bias)
* This is not future price, but a synthetic path showing how the Donchian/ATR/ADX model “expects” price to drift across multiple horizons.
* Bias table (top-center)
* `Bias: X.Y%`
* > 0% (green) → net upward bias across horizons
* < 0% (red) → net downward bias
* Magnitude (e.g., ±70–100%) ≈ strength of the directional skew.
* `ADX:` current ADX value (from your DMI settings).
* `ADXBlend:` the signed ADX factor in [-1, +1]:
* +1 ≈ fully “trend-interpretation” of Donchian behavior
* 0 ≈ neutral / mixed regime
* -1 ≈ fully “reversed/mean-reversion interpretation”
---
Inputs & settings
Core Donchian / ATR
* Donchian Length – lookback for Donchian high/low on each horizon.
* Price Source – input series used for position inside the Donchian channel (default: close).
* ATR Length – ATR lookback for all horizons.
* ATR Multiplier – scales the size of each forecast step in price units (higher = longer segments / more aggressive forecast).
*Local behavior at high ADX
* Reversed local blend at high ADX?
* Off (default) – edges behave more trend-like, middle more mean-reverting.
* On – flips that logic (edges more mean-reverting, middle more trend-like).
* The actual effect is always modulated by the global ADX factor, so you can experiment with how the regime logic feels in different markets.
Global ADX blending
* DMI DI Length – period for the DI+ and DI- components.
* ADX Smoothing – smoothing length for ADX.
* ADX low (mean-rev zone) – below this level, the global factor pushes behavior toward reversal/range logic .
* ADX high (trend zone) – above this level, the global factor pushes behavior toward **trend logic**.
* Values between low and high create a smooth blend rather than a hard on/off switch.
---
How to use it (examples)
* Directional bias dashboard
* Use the Bias % as a compact summary of multi-horizon Donchian/ATR/ADX conditions:
* Consider only trades aligned with the sign of Bias (e.g., longs only when Bias > 0).
* Use the magnitude to filter for **strong vs weak** directional contexts.
* Regime-aware context
* Watch ADX and ADXBlend:
* High ADX & ADXBlend ≈ +1 → favor trend-continuation ideas.
* Low ADX & ADXBlend ≈ -1 → favor range/mean-reversion ideas.
* Around 0 → mixed/transition regimes; forecasts will be more muted.
* Visual sanity check for systems
* Overlay Donchian Forecast on your usual entries/exits to see:
* When your system trades **with** the multi-TF Donchian bias.
* When it trades **against** it (possible fade setups or no-trade zones).
This script does not generate entry or exit signals by itself. It is a contextual/forecast tool meant to sit on top of your own trading logic.
---
Notes
* Works on most symbols and timeframes; higher-timeframe multiples are built from the chart timeframe.
* The forecast line is a model-based projection, not a prediction or guarantee of future price.
* Always combine this with your own risk management, testing, and judgement. This is for educational and analytical purposes only and is not financial advice.
Phát hành các Ghi chú
ROC of ADX considered in the weightingPhát hành các Ghi chú
clearer displayMã nguồn mở
Theo đúng tinh thần TradingView, tác giả của tập lệnh này đã công bố nó dưới dạng mã nguồn mở, để các nhà giao dịch có thể xem xét và xác minh chức năng. Chúc mừng tác giả! Mặc dù bạn có thể sử dụng miễn phí, hãy nhớ rằng việc công bố lại mã phải tuân theo Nội quy.
Thông báo miễn trừ trách nhiệm
Thông tin và các ấn phẩm này không nhằm mục đích, và không cấu thành, lời khuyên hoặc khuyến nghị về tài chính, đầu tư, giao dịch hay các loại khác do TradingView cung cấp hoặc xác nhận. Đọc thêm tại Điều khoản Sử dụng.
Mã nguồn mở
Theo đúng tinh thần TradingView, tác giả của tập lệnh này đã công bố nó dưới dạng mã nguồn mở, để các nhà giao dịch có thể xem xét và xác minh chức năng. Chúc mừng tác giả! Mặc dù bạn có thể sử dụng miễn phí, hãy nhớ rằng việc công bố lại mã phải tuân theo Nội quy.
Thông báo miễn trừ trách nhiệm
Thông tin và các ấn phẩm này không nhằm mục đích, và không cấu thành, lời khuyên hoặc khuyến nghị về tài chính, đầu tư, giao dịch hay các loại khác do TradingView cung cấp hoặc xác nhận. Đọc thêm tại Điều khoản Sử dụng.