OPEN-SOURCE SCRIPT
Cập nhật GANN Level (Salil Sir)
GANN Level Indicator Description
This Pine Script calculates and plots Gann Levels based on a user-defined price input. It creates horizontal lines at key support and resistance levels derived from the input price, applying Gann's theory of market structure. The levels are dynamically calculated and squared for enhanced precision.
Key Features:
Manual Price Input:
The user inputs a round off of square root of base price (Manual_Input), which serves as the foundation for calculations.
Support and Resistance Levels:
Six resistance levels (R1 to R6) and six support levels (S1 to S6) are calculated by incrementing or decrementing the base price in steps of 0.25.
Squared Levels:
Each level is squared (level^2) to align with Gann's mathematical principles.
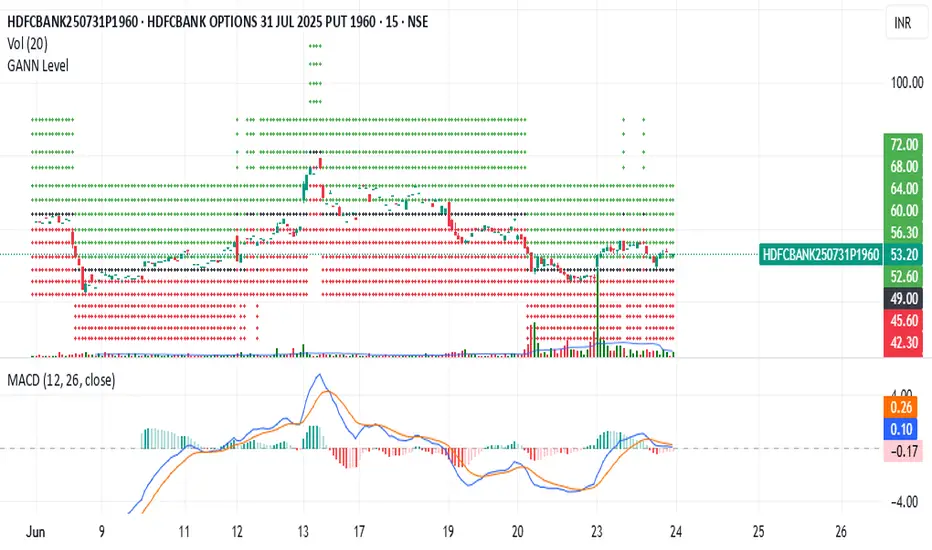
Visualization:
All levels, including the base price squared (GANN), are plotted as horizontal dotted lines:
Black Line: Base price squared (Gann Level).
Green Lines: Resistance levels.
Red Lines: Support levels.
Purpose:
The indicator helps traders identify potential support and resistance zones based on Gann's methodology, providing a mathematical framework for decision-making.
Usage:
Adjust the Manual Price in the settings to the desired value.
Observe the plotted levels for key support and resistance zones on the chart.
Use these levels to make informed trading decisions or to validate other indicators.
This Pine Script calculates and plots Gann Levels based on a user-defined price input. It creates horizontal lines at key support and resistance levels derived from the input price, applying Gann's theory of market structure. The levels are dynamically calculated and squared for enhanced precision.
Key Features:
Manual Price Input:
The user inputs a round off of square root of base price (Manual_Input), which serves as the foundation for calculations.
Support and Resistance Levels:
Six resistance levels (R1 to R6) and six support levels (S1 to S6) are calculated by incrementing or decrementing the base price in steps of 0.25.
Squared Levels:
Each level is squared (level^2) to align with Gann's mathematical principles.
Visualization:
All levels, including the base price squared (GANN), are plotted as horizontal dotted lines:
Black Line: Base price squared (Gann Level).
Green Lines: Resistance levels.
Red Lines: Support levels.
Purpose:
The indicator helps traders identify potential support and resistance zones based on Gann's methodology, providing a mathematical framework for decision-making.
Usage:
Adjust the Manual Price in the settings to the desired value.
Observe the plotted levels for key support and resistance zones on the chart.
Use these levels to make informed trading decisions or to validate other indicators.
Phát hành các Ghi chú
Dear GANN Level Users,We’re excited to announce an update to the GANN Level indicator! Now, there’s no need to manually input any values. Simply apply the indicator to any chart, and it will automatically calculate and plot GANN levels based on the square root of the opening price for the selected script.
These levels are dynamically updated and follow the price movement, ensuring real-time support and resistance zones. We hope this improvement enhances your trading experience and makes the tool even more convenient and enjoyable to use.
Happy trading! 🚀
Phát hành các Ghi chú
Bug FixedPhát hành các Ghi chú
Bug FixedMã nguồn mở
Theo đúng tinh thần TradingView, tác giả của tập lệnh này đã công bố nó dưới dạng mã nguồn mở, để các nhà giao dịch có thể xem xét và xác minh chức năng. Chúc mừng tác giả! Mặc dù bạn có thể sử dụng miễn phí, hãy nhớ rằng việc công bố lại mã phải tuân theo Nội quy.
Thông báo miễn trừ trách nhiệm
Thông tin và các ấn phẩm này không nhằm mục đích, và không cấu thành, lời khuyên hoặc khuyến nghị về tài chính, đầu tư, giao dịch hay các loại khác do TradingView cung cấp hoặc xác nhận. Đọc thêm tại Điều khoản Sử dụng.
Mã nguồn mở
Theo đúng tinh thần TradingView, tác giả của tập lệnh này đã công bố nó dưới dạng mã nguồn mở, để các nhà giao dịch có thể xem xét và xác minh chức năng. Chúc mừng tác giả! Mặc dù bạn có thể sử dụng miễn phí, hãy nhớ rằng việc công bố lại mã phải tuân theo Nội quy.
Thông báo miễn trừ trách nhiệm
Thông tin và các ấn phẩm này không nhằm mục đích, và không cấu thành, lời khuyên hoặc khuyến nghị về tài chính, đầu tư, giao dịch hay các loại khác do TradingView cung cấp hoặc xác nhận. Đọc thêm tại Điều khoản Sử dụng.