OPEN-SOURCE SCRIPT
Failed 2D & Failed 2U Bars
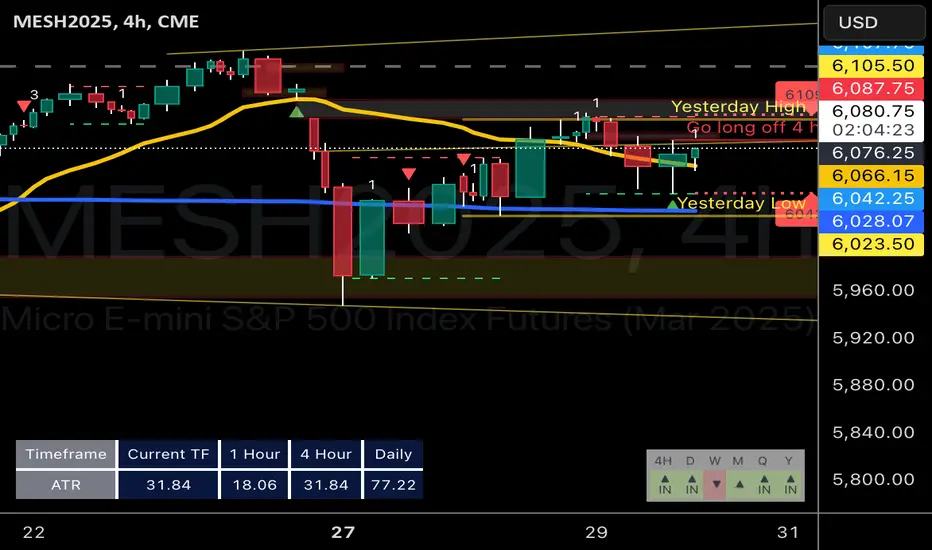
I created this indicator to plot a triangle when a candle is either 1) a failed 2 down--the candle breaks the low of the prior candle but closes green (or higher than its opening price) and doesn't break the high of the previous candle; and 2) a failed 2 up--high of the prior candle is broken but the bar is red and does not break the low of the prior candle.
It has alerts which you can set up in the alert system.
I think that this candle is one of the most telling and powerful when it comes to candle analysis.
R.I.P. Rob Smith, Creator of The Strat.
It has alerts which you can set up in the alert system.
I think that this candle is one of the most telling and powerful when it comes to candle analysis.
R.I.P. Rob Smith, Creator of The Strat.
Mã nguồn mở
Theo đúng tinh thần TradingView, người tạo ra tập lệnh này đã biến tập lệnh thành mã nguồn mở để các nhà giao dịch có thể xem xét và xác minh công năng. Xin dành lời khen tặng cho tác giả! Mặc dù bạn có thể sử dụng miễn phí, nhưng lưu ý nếu đăng lại mã, bạn phải tuân theo Quy tắc nội bộ của chúng tôi.
Thông báo miễn trừ trách nhiệm
Thông tin và ấn phẩm không có nghĩa là và không cấu thành, tài chính, đầu tư, kinh doanh, hoặc các loại lời khuyên hoặc khuyến nghị khác được cung cấp hoặc xác nhận bởi TradingView. Đọc thêm trong Điều khoản sử dụng.