OPEN-SOURCE SCRIPT
TTM Squeeze @DaviddTech
Credits:
Innovation: John Carter's development of the TTM Squeeze and its enhanced version, TTM Squeeze Pro.
Interpretation: Lazybear's foundational Squeeze Momentum Indicator, derived from the original TTM Squeeze.
Enhancement: Makit0's refinement of Lazybear's script to integrate features from the TTM Squeeze Pro, resulting in the Squeeze PRO Arrows.
Overview of Modifications:
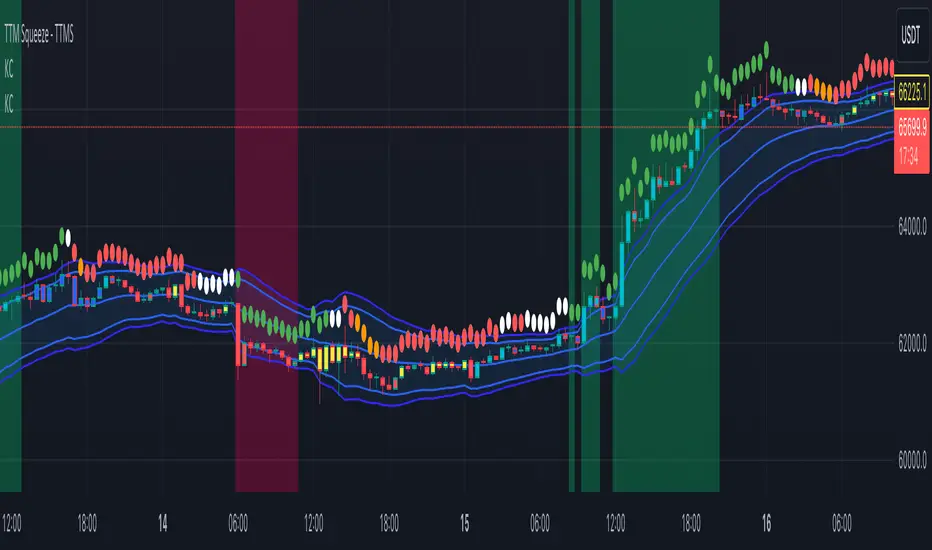
This adaptation synergizes the collective advancements of Carter, Lazybear, and Makit0, focusing specifically on refining squeeze conditions to align with the official TTM Squeeze Pro's color coding. Unlike its predecessors, the TTM Squeeze Pro is integrated directly over the price bars, enhancing visibility and immediate interpretation.
Fundamentals of TTM Squeeze:
The TTM Squeeze indicator illustrates the relationship between Bollinger Bands (standard deviations from a simple moving average) and Keltner Channels (average true range bands), juxtaposed with price action momentum. It signals the tightening of volatility, represented by Bollinger Bands constricting within Keltner Channels, which typically precedes a significant price movement.
Comparative Enhancements:
Both the original and Pro versions utilize a 2 standard deviation Bollinger Band.
The original employed a 1.5 ATR Keltner Channel; the Pro version employs 1.0, 1.5, and 2.0 ATR Keltner Channels, aiding in discerning various levels of market compression and potential for explosive movements.
Indicator Visualization:
Histogram: Displays price momentum.
Colored Dots (on the zeroline): Indicate the position of Bollinger Bands relative to Keltner Channels:
Cyan Bars: Positive, increasing momentum.
Blue Bars: Positive, decreasing momentum (potential reversal).
Red Bars: Negative, increasing momentum.
Yellow Bars: Negative, decreasing momentum (potential reversal).
Orange Dots: High compression (significant potential for price movement).
Red Dots: Medium compression.
White Dots: Low compression (initial squeeze stage).
Green Dots: No squeeze (indicative of a "squeeze fired" scenario).
Ideal Market Behavior:
The progression from black to green dots ideally signals the unfolding of a squeeze: starting with low compression (black), escalating to medium (red), peaking at high compression (orange), and culminating in the firing of the squeeze as indicated by green dots. This sequence, while ideal, may vary; hence, the primary trading signal is the appearance of green dots post-compression.
Entry and Exit Strategy:
Entry: John Carter advocates entering a position post at least five consecutive black dots or upon the appearance of the first green dot.
Exit: Consider exiting at the second occurrence of either blue or yellow bars, or maintain the position if subsequent indicators confirm an ongoing trend.
This format focuses on clear, disciplined presentation aligned with NNFX principles, emphasizing systematic trading decisions based on indicator behavior.
Innovation: John Carter's development of the TTM Squeeze and its enhanced version, TTM Squeeze Pro.
Interpretation: Lazybear's foundational Squeeze Momentum Indicator, derived from the original TTM Squeeze.
Enhancement: Makit0's refinement of Lazybear's script to integrate features from the TTM Squeeze Pro, resulting in the Squeeze PRO Arrows.
Overview of Modifications:
This adaptation synergizes the collective advancements of Carter, Lazybear, and Makit0, focusing specifically on refining squeeze conditions to align with the official TTM Squeeze Pro's color coding. Unlike its predecessors, the TTM Squeeze Pro is integrated directly over the price bars, enhancing visibility and immediate interpretation.
Fundamentals of TTM Squeeze:
The TTM Squeeze indicator illustrates the relationship between Bollinger Bands (standard deviations from a simple moving average) and Keltner Channels (average true range bands), juxtaposed with price action momentum. It signals the tightening of volatility, represented by Bollinger Bands constricting within Keltner Channels, which typically precedes a significant price movement.
Comparative Enhancements:
Both the original and Pro versions utilize a 2 standard deviation Bollinger Band.
The original employed a 1.5 ATR Keltner Channel; the Pro version employs 1.0, 1.5, and 2.0 ATR Keltner Channels, aiding in discerning various levels of market compression and potential for explosive movements.
Indicator Visualization:
Histogram: Displays price momentum.
Colored Dots (on the zeroline): Indicate the position of Bollinger Bands relative to Keltner Channels:
Cyan Bars: Positive, increasing momentum.
Blue Bars: Positive, decreasing momentum (potential reversal).
Red Bars: Negative, increasing momentum.
Yellow Bars: Negative, decreasing momentum (potential reversal).
Orange Dots: High compression (significant potential for price movement).
Red Dots: Medium compression.
White Dots: Low compression (initial squeeze stage).
Green Dots: No squeeze (indicative of a "squeeze fired" scenario).
Ideal Market Behavior:
The progression from black to green dots ideally signals the unfolding of a squeeze: starting with low compression (black), escalating to medium (red), peaking at high compression (orange), and culminating in the firing of the squeeze as indicated by green dots. This sequence, while ideal, may vary; hence, the primary trading signal is the appearance of green dots post-compression.
Entry and Exit Strategy:
Entry: John Carter advocates entering a position post at least five consecutive black dots or upon the appearance of the first green dot.
Exit: Consider exiting at the second occurrence of either blue or yellow bars, or maintain the position if subsequent indicators confirm an ongoing trend.
This format focuses on clear, disciplined presentation aligned with NNFX principles, emphasizing systematic trading decisions based on indicator behavior.
Mã nguồn mở
Theo đúng tinh thần TradingView, người tạo ra tập lệnh này đã biến tập lệnh thành mã nguồn mở để các nhà giao dịch có thể xem xét và xác minh công năng. Xin dành lời khen tặng cho tác giả! Mặc dù bạn có thể sử dụng miễn phí, nhưng lưu ý nếu đăng lại mã, bạn phải tuân theo Quy tắc nội bộ của chúng tôi.
✅💰⚡ Become part of the community get early get access here:
daviddtech.com
🔥Telegram Group:
t.me/DaviddTech
⚡ Videos & Tutorials :
youtube.com/channel/UC7NJLsf6IonOy8QI8gt5BeA?sub_confirmation=1
♥ @DaviddTech
daviddtech.com
🔥Telegram Group:
t.me/DaviddTech
⚡ Videos & Tutorials :
youtube.com/channel/UC7NJLsf6IonOy8QI8gt5BeA?sub_confirmation=1
♥ @DaviddTech
Thông báo miễn trừ trách nhiệm
Thông tin và ấn phẩm không có nghĩa là và không cấu thành, tài chính, đầu tư, kinh doanh, hoặc các loại lời khuyên hoặc khuyến nghị khác được cung cấp hoặc xác nhận bởi TradingView. Đọc thêm trong Điều khoản sử dụng.