OPEN-SOURCE SCRIPT
Cập nhật YCGH Drawdown Percentiles
What This Indicator Does?
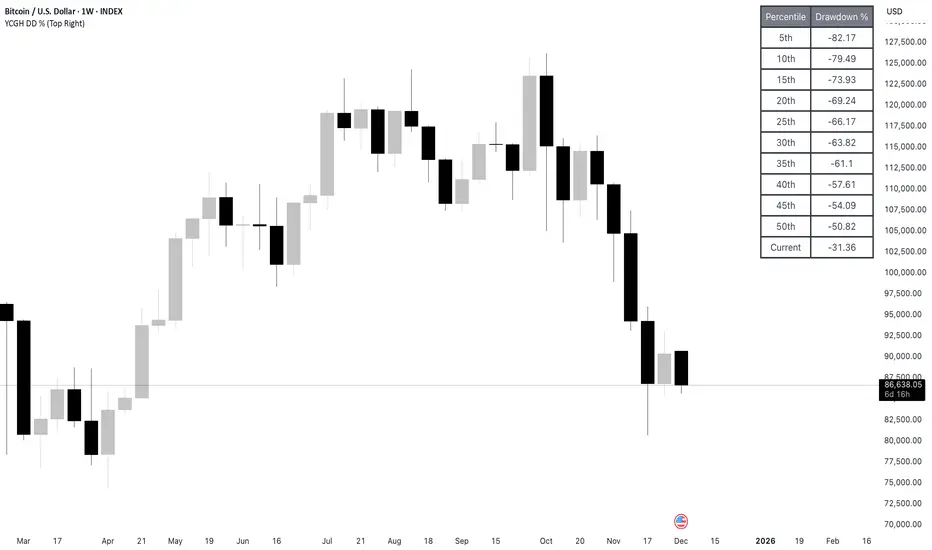
The Drawdown Percentiles indicator tracks how far below the all-time high (ATH) a stock or asset is currently trading, then displays statistical percentiles of historical drawdowns in a customizable table.
Percentile Analysis: It collects up to 5,000 historical bars of drawdown data, sorts them, and calculates user-selected percentiles (default: 10th, 30th, 50th) to show where current drawdowns rank historically.
Visual Display: A table shows each percentile threshold with color-coded drawdown values, helping you quickly assess whether the current drawdown is typical or extreme compared to historical patterns.
Practical Use Cases
Risk Assessment: Identify if current drawdowns fall within normal ranges or represent extreme conditions requiring position adjustments.
Entry/Exit Timing: Use percentile rankings to time entries during historically shallow drawdowns (better conditions) and reduce exposure during deep drawdowns.
Strategy Comparison: Compare drawdown patterns across different assets or trading strategies to evaluate risk-adjusted performance.
Phát hành các Ghi chú
updated tablePhát hành các Ghi chú
logic updatedPhát hành các Ghi chú
updated TablePhát hành các Ghi chú
removed linesPhát hành các Ghi chú
table made fancyPhát hành các Ghi chú
Summary of Functional Changes:Fixed 10 percentiles instead of 3 customizable ones
Complete percentile calculation logic that actually works
Full table border on all sides (frame)
Individual color customization for each percentile level
Current drawdown display as the last row
Visual ATH reference on the chart
Proper data storage in array for historical analysis
Mã nguồn mở
Theo đúng tinh thần TradingView, tác giả của tập lệnh này đã công bố nó dưới dạng mã nguồn mở, để các nhà giao dịch có thể xem xét và xác minh chức năng. Chúc mừng tác giả! Mặc dù bạn có thể sử dụng miễn phí, hãy nhớ rằng việc công bố lại mã phải tuân theo Nội quy.
YCGH Capital
Thông báo miễn trừ trách nhiệm
Thông tin và các ấn phẩm này không nhằm mục đích, và không cấu thành, lời khuyên hoặc khuyến nghị về tài chính, đầu tư, giao dịch hay các loại khác do TradingView cung cấp hoặc xác nhận. Đọc thêm tại Điều khoản Sử dụng.