OPEN-SOURCE SCRIPT
McGinley Dynamic x Donchian Channels
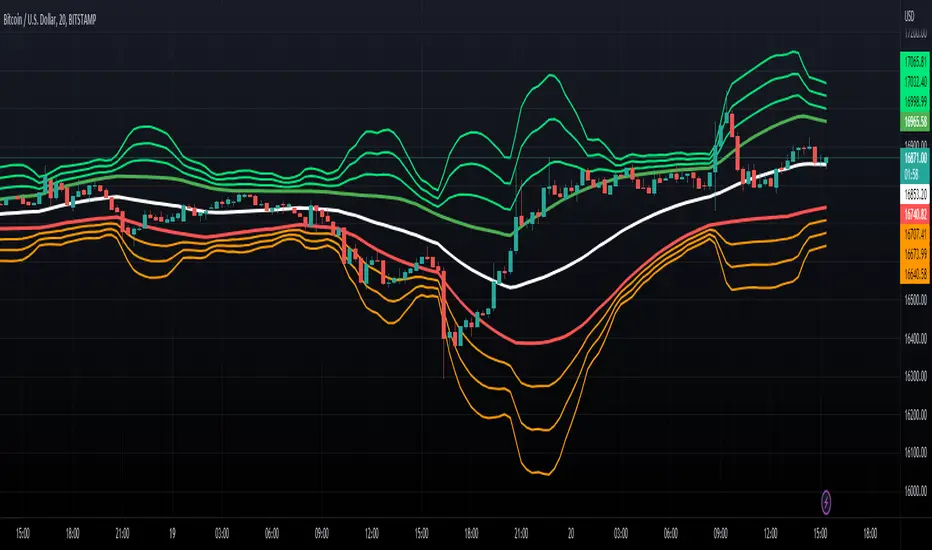
This indicator combines the McGinley Dynamic and Donchian Channels by taking the lowest and highest values over a set length (defaulted to 14) then applying the McGinley Dynamic math to these values. The upper range is denoted by a green line while the lower range is denoted by a red line. Additionally, standard deviations of 1, 2, and 3 have been put in place using the upper and lower values as the basis for the deviations as opposed to the baseline average of the upper and lower bands. These deviations are plotted as lime and orange colors. These channels can be used to determine when the price is gaining or losing momentum based on the distance between the channels. Otherwise, the channels can be used to determine potential overbought and oversold levels.
Mã nguồn mở
Theo đúng tinh thần TradingView, tác giả của tập lệnh này đã công bố nó dưới dạng mã nguồn mở, để các nhà giao dịch có thể xem xét và xác minh chức năng. Chúc mừng tác giả! Mặc dù bạn có thể sử dụng miễn phí, hãy nhớ rằng việc công bố lại mã phải tuân theo Nội quy.
Thông báo miễn trừ trách nhiệm
Thông tin và các ấn phẩm này không nhằm mục đích, và không cấu thành, lời khuyên hoặc khuyến nghị về tài chính, đầu tư, giao dịch hay các loại khác do TradingView cung cấp hoặc xác nhận. Đọc thêm tại Điều khoản Sử dụng.