OPEN-SOURCE SCRIPT
Cập nhật BTC Power of Law x Central Bank Liquidity
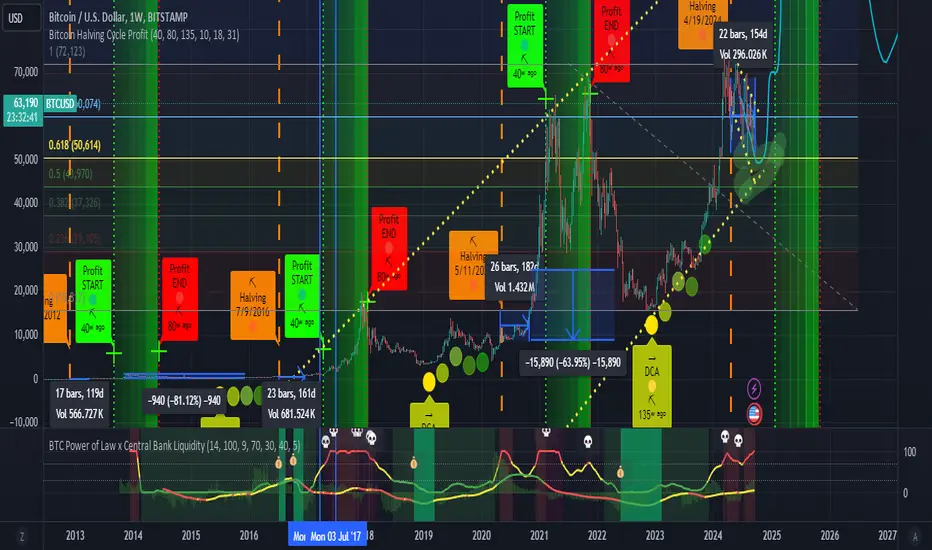
This indicator combines Bitcoin's long-term growth model (Power Law) with global central bank liquidity to help identify potential buy and sell signals.
How it works:
Power Law Oscillator: This part of the indicator tracks how far Bitcoin's current price is from its expected long-term growth, based on an exponential model. It helps you see when Bitcoin may be overbought (too expensive) or oversold (cheap) compared to its historical trend.
Central Bank Liquidity: This measures the amount of money injected into the financial system by major central banks (like the Fed or ECB). When more money is printed, asset prices, including Bitcoin, tend to rise. When liquidity dries up, prices often fall.
By combining these two factors, the indicator gives you a more accurate view of Bitcoin's price trends.
How to interpret:
Green Line: Bitcoin is undervalued compared to its long-term growth, and the liquidity environment is supportive. This is typically a buy signal.
Yellow Line: Bitcoin is trading near its expected value, or there's uncertainty due to mixed liquidity conditions. This is a hold signal.
Red Line: Bitcoin is overvalued, or liquidity is tightening. This is a potential sell signal.
Zones:
The background will turn green when Bitcoin is in a buy zone and red when it's in a sell zone, giving you easy-to-read visual cues.
Phát hành các Ghi chú
Now with central bank money supply histogramPhát hành các Ghi chú
Added some emoji for better visualizationPhát hành các Ghi chú
Fixed bug with emojisPhát hành các Ghi chú
Clearer high prob buy zonesMã nguồn mở
Theo đúng tinh thần TradingView, tác giả của tập lệnh này đã công bố nó dưới dạng mã nguồn mở, để các nhà giao dịch có thể xem xét và xác minh chức năng. Chúc mừng tác giả! Mặc dù bạn có thể sử dụng miễn phí, hãy nhớ rằng việc công bố lại mã phải tuân theo Nội quy.
Thông báo miễn trừ trách nhiệm
Thông tin và các ấn phẩm này không nhằm mục đích, và không cấu thành, lời khuyên hoặc khuyến nghị về tài chính, đầu tư, giao dịch hay các loại khác do TradingView cung cấp hoặc xác nhận. Đọc thêm tại Điều khoản Sử dụng.
Mã nguồn mở
Theo đúng tinh thần TradingView, tác giả của tập lệnh này đã công bố nó dưới dạng mã nguồn mở, để các nhà giao dịch có thể xem xét và xác minh chức năng. Chúc mừng tác giả! Mặc dù bạn có thể sử dụng miễn phí, hãy nhớ rằng việc công bố lại mã phải tuân theo Nội quy.
Thông báo miễn trừ trách nhiệm
Thông tin và các ấn phẩm này không nhằm mục đích, và không cấu thành, lời khuyên hoặc khuyến nghị về tài chính, đầu tư, giao dịch hay các loại khác do TradingView cung cấp hoặc xác nhận. Đọc thêm tại Điều khoản Sử dụng.