OPEN-SOURCE SCRIPT
Cập nhật Elliott Wave Analysis

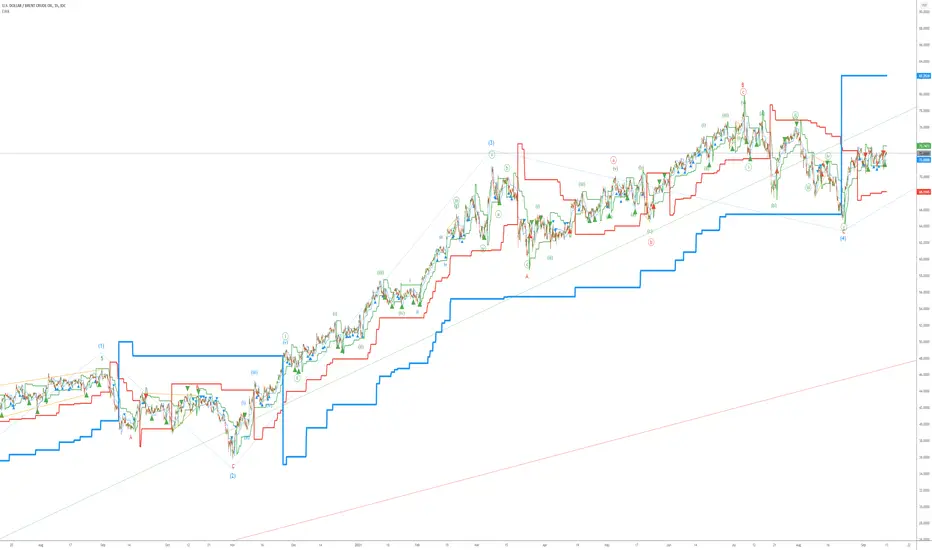
Initially, Elliott wave analysis is designed to simplify and increase the objectivity of graph analysis using the Elliott method. Probably, this indicator can be successfully used in trading without knowing the Elliott method.
The indicator is based on a supertrend. Supertrends are built in accordance with the Fibonacci grid. The degree of waves in the indicator settings corresponds to a 1-hour timeframe - this is the main mode of working with the indicator. I also recommend using weekly (for evaluating large movements) and 1-minute timeframes.
When using other timeframes, the baseline of the indicator will correspond to:
1 min-Submicro
5 minutes-Micro
15 minutes-Subminuette
1 hour-Minuette
4 hours-Minute
Day-Minor
Week-Intermediate
Month-Primary
Those who are well versed in the Elliott method can see that the waves fall on the indicator almost perfectly. To demonstrate this, I put the markup on the graph
Phát hành các Ghi chú
Added 3 levels of trading signals. The entry is carried out on a correction, counting on the resumption of the trend. The color of the signal corresponds to this trend.Phát hành các Ghi chú
Added a pair of Minuette signals. Added filters for all signals: rejected signals on too fast and too slow trendPhát hành các Ghi chú
Filtering is now optionalPhát hành các Ghi chú
The filter has been changed. Now only signals that are very far from the old trend line are rejectedPhát hành các Ghi chú
All blue signals directed against the red trend have been removedPhát hành các Ghi chú
-- The visualization of signals has been changed -- The indicator colors are now tied to the degrees of the waves, regardless of the timeframe. For example, for Line 1(the fastest indicator line) for different timeframes, the colors (by default) will be as follows:
1 min-Submicro blue
5 minutes-Micro green
15 minutes-Subminuette red
1 hour-Minuette blue
4 hours-Minute green
Day-Minor red
Week-Intermediate blue
Month-Primary green
Phát hành các Ghi chú
-- The script is adapted for version 5 of the Pine editor-- Added line 0, which participates in the formation of sell1/buy1 signals. By default, it is not displayed
-- Lines 4 and 5 are now not displayed by default for ease of perception
Mã nguồn mở
Theo đúng tinh thần TradingView, tác giả của tập lệnh này đã công bố nó dưới dạng mã nguồn mở, để các nhà giao dịch có thể xem xét và xác minh chức năng. Chúc mừng tác giả! Mặc dù bạn có thể sử dụng miễn phí, hãy nhớ rằng việc công bố lại mã phải tuân theo Nội quy.
Thông báo miễn trừ trách nhiệm
Thông tin và các ấn phẩm này không nhằm mục đích, và không cấu thành, lời khuyên hoặc khuyến nghị về tài chính, đầu tư, giao dịch hay các loại khác do TradingView cung cấp hoặc xác nhận. Đọc thêm tại Điều khoản Sử dụng.