This is an attempt to develop alternative visualisation of financial charts. This script also makes use of new pine feature types which represents User Defined Object Types. You can refer to below documentation to understand more about this feature:
🎲 Structure of new chart components
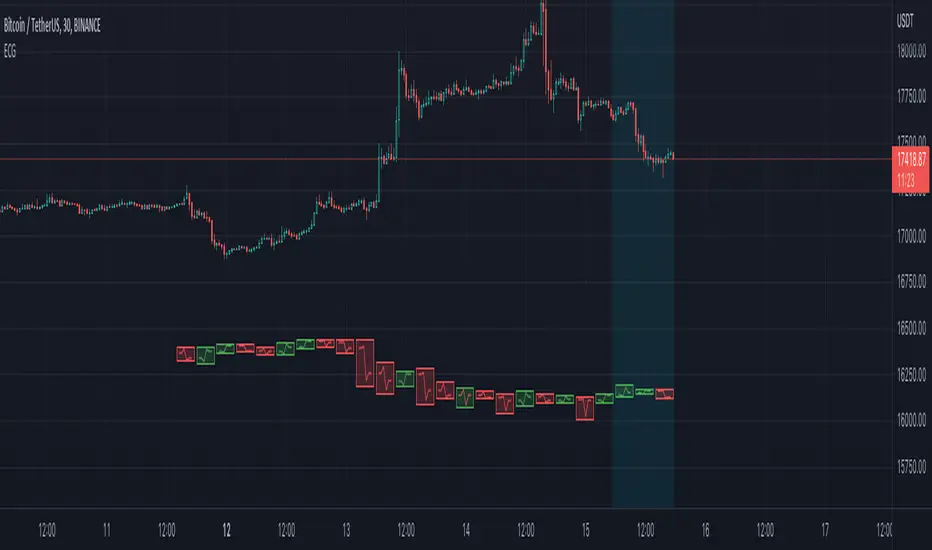
🎯Instead of candles/bars, this type of chart contains Electrocardiogram blocks which resembles the heartbeat signals on electrocardiogram.
🎯Inside each blocks there will be 5 connecting lines called the signal lines.
🎯 Color of the signal lines are determined by which among the high/low of the bar comes last. If highest part of the bar reached after reaching the lowest part of the bar, then signal lines are coloured green signifying bullish sentiment towards the end of bar. If lowest part of the bar reached after reaching the highest part of the bar, then signal lines are coloured red signifying bearish sentiment towards the end of bar.
Pictorial examples here:

🎲 Limitations with pinescript implementation
Thanks to @theheirophant for suggestion of name :)
- tradingview.com/pine-script-docs/en/v5/language/Objects.html
- tradingview.com/pine-script-reference/v5/
🎲 Structure of new chart components
🎯Instead of candles/bars, this type of chart contains Electrocardiogram blocks which resembles the heartbeat signals on electrocardiogram.
- Body color of the block is defined by the open and close prices of the bar. If close is greater than open, body is green. Otherwise, the body is painted red.
- Border color of the block is defined by the close prices of current and previous bar. If the close of current bar is greater than that of last bar, then the border color is green. Otherwise, border color is painted red.
🎯Inside each blocks there will be 5 connecting lines called the signal lines.
- open-open
- open-firstPeak(high or low of the bar whichever comes first)
- firstPeak-secondPeak(high or low of the bar whichever comes last)
- secondPeak-close
- close-close
🎯 Color of the signal lines are determined by which among the high/low of the bar comes last. If highest part of the bar reached after reaching the lowest part of the bar, then signal lines are coloured green signifying bullish sentiment towards the end of bar. If lowest part of the bar reached after reaching the highest part of the bar, then signal lines are coloured red signifying bearish sentiment towards the end of bar.
Pictorial examples here:
🎲 Limitations with pinescript implementation
- Since, pinescript can only use maximum 500 lines and each block will take 1 box and 5 lines, it is not possible to display more than 100 bars.
- Each block of new Electrocardiogram chart will take the space of 7 bars of candlestick chart. Due to this, the alignment of regular OHLC candles is not inline with the new chart type. Background highlighting is done for the part of the OHLC candles where Electrocardiogram blocks are plotted so that it helps users to map the bars manually
Thanks to @theheirophant for suggestion of name :)
Phát hành các Ghi chú
Update time format logic using str.format_time
Phát hành các Ghi chú
Replace for loop with for..in loop as the issue with latter is resolved. Also updated logic to calculate offset to avoid candles overlapping with standard candles.Mã nguồn mở
Theo đúng tinh thần TradingView, tác giả của tập lệnh này đã công bố nó dưới dạng mã nguồn mở, để các nhà giao dịch có thể xem xét và xác minh chức năng. Chúc mừng tác giả! Mặc dù bạn có thể sử dụng miễn phí, hãy nhớ rằng việc công bố lại mã phải tuân theo Nội quy.
Trial - trendoscope.io/trial
Subscribe - trendoscope.io/pricing
Blog - docs.trendoscope.io
Subscribe - trendoscope.io/pricing
Blog - docs.trendoscope.io
Thông báo miễn trừ trách nhiệm
Thông tin và các ấn phẩm này không nhằm mục đích, và không cấu thành, lời khuyên hoặc khuyến nghị về tài chính, đầu tư, giao dịch hay các loại khác do TradingView cung cấp hoặc xác nhận. Đọc thêm tại Điều khoản Sử dụng.
Mã nguồn mở
Theo đúng tinh thần TradingView, tác giả của tập lệnh này đã công bố nó dưới dạng mã nguồn mở, để các nhà giao dịch có thể xem xét và xác minh chức năng. Chúc mừng tác giả! Mặc dù bạn có thể sử dụng miễn phí, hãy nhớ rằng việc công bố lại mã phải tuân theo Nội quy.
Trial - trendoscope.io/trial
Subscribe - trendoscope.io/pricing
Blog - docs.trendoscope.io
Subscribe - trendoscope.io/pricing
Blog - docs.trendoscope.io
Thông báo miễn trừ trách nhiệm
Thông tin và các ấn phẩm này không nhằm mục đích, và không cấu thành, lời khuyên hoặc khuyến nghị về tài chính, đầu tư, giao dịch hay các loại khác do TradingView cung cấp hoặc xác nhận. Đọc thêm tại Điều khoản Sử dụng.