OPEN-SOURCE SCRIPT
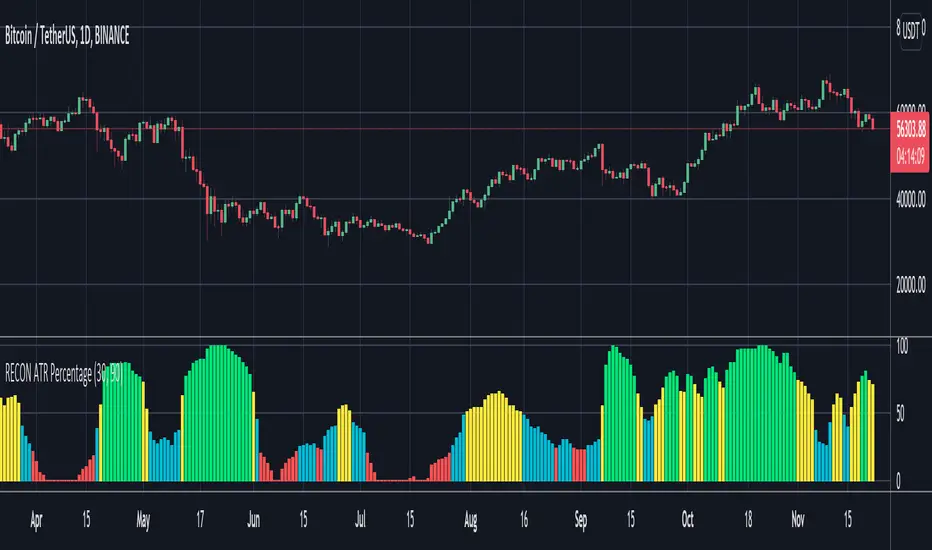
RECON ATR Volatility Percentage

The original Average True Range (ATR) indicator is a technical analysis indicator designed to measure volatility. The higher the ATR the higher the volatility.
The RECON ATR Volatility Percentage indicator calculates the Average True Range (ATR) as a percentage.
Suggested chart timeframes: 1h, 4h and 1D seem to produce the most useful intel but can be used on lower timeframes as well.
The Recon ATR Volatility Percentage can be utilized for identifying trading pairs with a desired amount of volatility, for example deploying a grid trading strategy on pairs that are trending up with a high amount of volatility (say over 50%) might produce desirable results.
It is important to note the ATR does not indicate price direction and can be high in both a rising or falling market.
The ATR Length, Period Look Back Length parameters as well as the color of the columns can be configured per your specifications.
Mã nguồn mở
Theo đúng tinh thần TradingView, tác giả của tập lệnh này đã công bố nó dưới dạng mã nguồn mở, để các nhà giao dịch có thể xem xét và xác minh chức năng. Chúc mừng tác giả! Mặc dù bạn có thể sử dụng miễn phí, hãy nhớ rằng việc công bố lại mã phải tuân theo Nội quy.
Thông báo miễn trừ trách nhiệm
Thông tin và các ấn phẩm này không nhằm mục đích, và không cấu thành, lời khuyên hoặc khuyến nghị về tài chính, đầu tư, giao dịch hay các loại khác do TradingView cung cấp hoặc xác nhận. Đọc thêm tại Điều khoản Sử dụng.