█ OVERVIEW
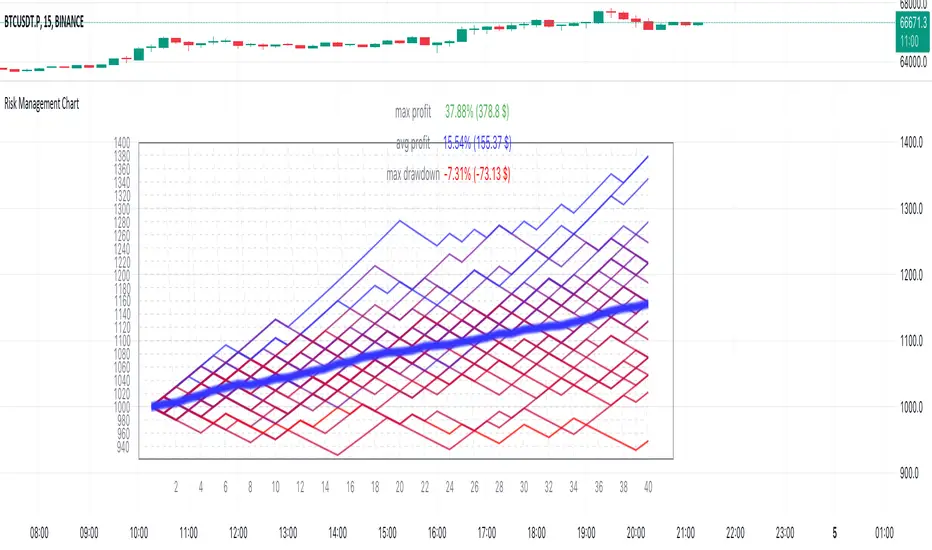
Risk Management Chart allows you to calculate and visualize equity and risk depend on your risk-reward statistics which you can set at the settings.
This script generates random trades and variants of each trade based on your settings of win/loss percent and shows it on the chart as different polyline and also shows thick line which is average of all trades.
It allows you to visualize and possible to analyze probability of your risk management. Be using different settings you can adjust and change your risk management for better profit in future.
It uses compound interest for each trade.
Each variant of trade is shown as a polyline with color from gradient depended on it last profit.
Also I made blurred lines for better visualization with function :
Pine Script®
█ HOW TO USE
Just add it to the cart and expand the window.

█ SETTINGS
Start Equity $ - Amount of money to start with (your equity for trades)
Win Probability % - Percent of your win / loss trades
Risk/Reward Ratio - How many profit you will get for each risk(depends on risk per trade %)
Number of Trades - How many trades will be generated for each variant of random trading
Number of variants(lines) - How many variants will be generated for each trade
Risk per Trade % -risk % of current equity for each trade
If you have any ask it at comments.
Hope it will be useful.
Risk Management Chart allows you to calculate and visualize equity and risk depend on your risk-reward statistics which you can set at the settings.
This script generates random trades and variants of each trade based on your settings of win/loss percent and shows it on the chart as different polyline and also shows thick line which is average of all trades.
It allows you to visualize and possible to analyze probability of your risk management. Be using different settings you can adjust and change your risk management for better profit in future.
It uses compound interest for each trade.
Each variant of trade is shown as a polyline with color from gradient depended on it last profit.
Also I made blurred lines for better visualization with function :
poly(_arr, _col, _t, _tr) =>
for t = 1 to _t
polyline.new(_arr, false, false, xloc.bar_index, color.new(_col, 0 + t * _tr), line_width = t)
█ HOW TO USE
Just add it to the cart and expand the window.
█ SETTINGS
Start Equity $ - Amount of money to start with (your equity for trades)
Win Probability % - Percent of your win / loss trades
Risk/Reward Ratio - How many profit you will get for each risk(depends on risk per trade %)
Number of Trades - How many trades will be generated for each variant of random trading
Number of variants(lines) - How many variants will be generated for each trade
Risk per Trade % -risk % of current equity for each trade
If you have any ask it at comments.
Hope it will be useful.
Mã nguồn mở
Theo đúng tinh thần TradingView, tác giả của tập lệnh này đã công bố nó dưới dạng mã nguồn mở, để các nhà giao dịch có thể xem xét và xác minh chức năng. Chúc mừng tác giả! Mặc dù bạn có thể sử dụng miễn phí, hãy nhớ rằng việc công bố lại mã phải tuân theo Nội quy.
Thông báo miễn trừ trách nhiệm
Thông tin và các ấn phẩm này không nhằm mục đích, và không cấu thành, lời khuyên hoặc khuyến nghị về tài chính, đầu tư, giao dịch hay các loại khác do TradingView cung cấp hoặc xác nhận. Đọc thêm tại Điều khoản Sử dụng.