OPEN-SOURCE SCRIPT
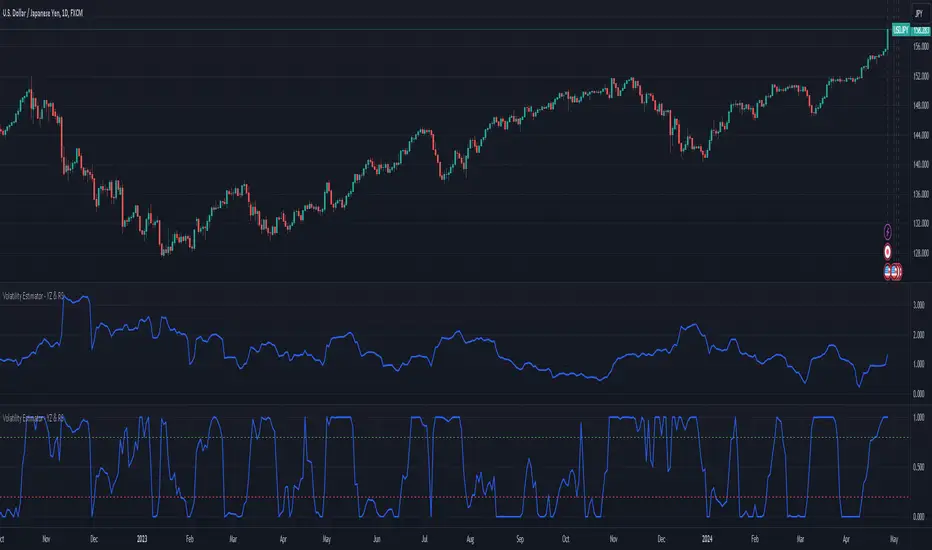
Volatility Estimator - YZ & RS
The Yang-Zheng Volatility Estimator (YZVE) integrates both intra-candle and inter-candle dynamics, such as overnight and weekend price changes, offering a more detailed analysis compared to traditional methods. The YZVE is proposed to improve over the standard deviation by accounting for the open, high, low, and close prices of trading periods, instead of only the close prices, and attempts to supplant the Parkinson's Volatility Estimator (PVE) by a also capturing inter-candle dynamics. The YZVE is calculated by this formula:
YZ Volatility Squared σ_YZ² = k * σ_o² + σ_rs² + (1 - k) * σ_c²
where k is a weighting factor that adjusts the emphasis between the overnight and close-to-close components, popularly estimated as:
k = 0.34 / (1.34 + (N+1) / (N-1))
where N is the lookback period. Optionally, users may opt to override this calculation with a specified constant (off by default). Next, the
Overnight Volatility Squared σ_o² = (log(O_t / C_(t-1)))²
measures the volatility associated with overnight price changes, from the previous candle's closing price C_(t-1) to the current candle's opening price O_t. It captures the market's reaction to news and events that occur outside of regular trading hours to reflect risk associated with holding positions over non-trading hours and gaps.
Next, the The Rogers-Satchell Volatility Estimator (RSVE) serves as an intermediary step in the computation of YZVE. It aggregates the logarithmic ratios between high, low, open, and close prices within each trading period, focusing on intra-candle volatility without assuming zero inter-candle drift as commonly implicitly assumed in other volatility models:
Rogers-Satchell Volatility Squared σ_rs² = (log(H_t / C_t) * log(H_t / O_t)) + (log(L_t / C_t) * log(L_t / O_t))
Finally,
Close-to-Close Volatility Squared σ_c² = (log(C_t / C_(t-1)))²
measures the volatility from the close of one candle to the close of the next. It reflects the typical candle volatility, similar to naive standard deviation.
This script also includes an option for users to apply the simpler RS Volatility exclusively, focusing on intraday price movements. Additionally, it offers a choice for normalization between 0 and 1, turning the estimator into an oscillator for comparing current volatility to recent levels. Horizontal lines at user-defined levels are also available for clearer visualization. Both are off by default.
References:
Yang, D., & Zhang, Q. (2000). Drift-independent volatility estimation based on high, low, open, and close prices. The Journal of Business, 73(3), 477-491.
Rogers, L.C.G., & Satchell, S.E. (1991). Estimating variance from high, low and closing prices. Annals of Applied Probability, 1(4), 504-512.
Mã nguồn mở
Theo đúng tinh thần TradingView, tác giả của tập lệnh này đã công bố nó dưới dạng mã nguồn mở, để các nhà giao dịch có thể xem xét và xác minh chức năng. Chúc mừng tác giả! Mặc dù bạn có thể sử dụng miễn phí, hãy nhớ rằng việc công bố lại mã phải tuân theo Nội quy.
Thông báo miễn trừ trách nhiệm
Thông tin và các ấn phẩm này không nhằm mục đích, và không cấu thành, lời khuyên hoặc khuyến nghị về tài chính, đầu tư, giao dịch hay các loại khác do TradingView cung cấp hoặc xác nhận. Đọc thêm tại Điều khoản Sử dụng.