OPEN-SOURCE SCRIPT
Cập nhật Volatility Meter
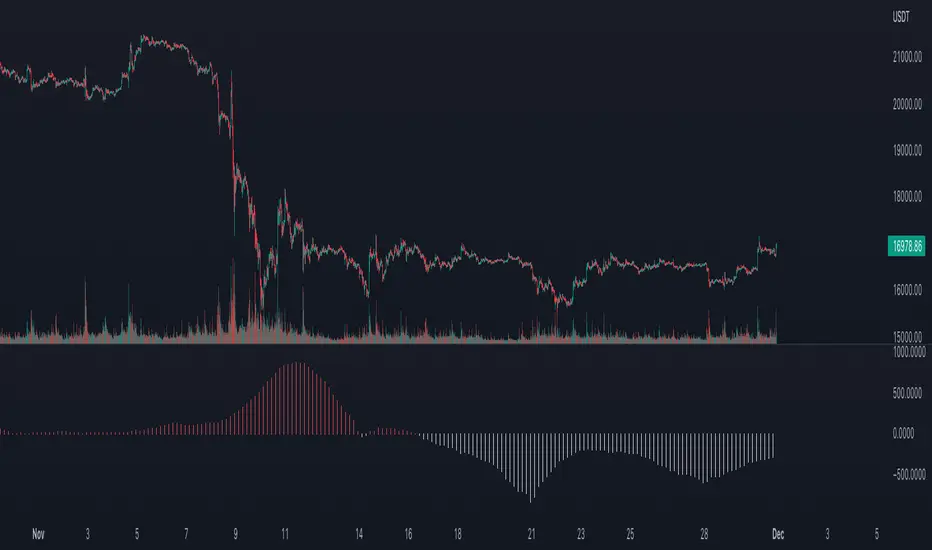
The title is quite self explanatory. It is a Volatility Meter based on Bollinger Bands Width and MA.
These parameters can be selected by users in settings tab:
- Basic Bollinger Bands Parameters: length, standart deviation and source
- Timeframes: 1h, 2h, 3h and 4h
If the indicator is red it means volatility is high in the market. If it is white, it means that market is not volatile right now.
These parameters can be selected by users in settings tab:
- Basic Bollinger Bands Parameters: length, standart deviation and source
- Timeframes: 1h, 2h, 3h and 4h
If the indicator is red it means volatility is high in the market. If it is white, it means that market is not volatile right now.
Phát hành các Ghi chú
The title is self-explanatory. It is a Volatility Meter based on Bollinger Bands Width and Moving Averages. It also uses the concept of multi-time frame analysis.You can decide the options below on the settings tab:
- Basic Bollinger Bands Parameters: length, standart deviation and source
- Timeframes: 1h, 2h, 3h and 4h
If the indicator is red, it means volatility is high in the market. If it is white, it means the market is not volatile right now. If you use it in a smaller timeframe than it is calculated then you will get the multi-timeframe analysis of the volatility. As could be seen on the chart above, if it is red it usually means that big market moves are expected.
Use it on 4H or smaller time frames to get the multi-time frame volatility insight. If you use it on the time frame greater than 4H please select the calculated time frame accordingly. (NOTE: credits on the source code is removed.)
Mã nguồn mở
Theo đúng tinh thần TradingView, tác giả của tập lệnh này đã công bố nó dưới dạng mã nguồn mở, để các nhà giao dịch có thể xem xét và xác minh chức năng. Chúc mừng tác giả! Mặc dù bạn có thể sử dụng miễn phí, hãy nhớ rằng việc công bố lại mã phải tuân theo Nội quy.
Thông báo miễn trừ trách nhiệm
Thông tin và các ấn phẩm này không nhằm mục đích, và không cấu thành, lời khuyên hoặc khuyến nghị về tài chính, đầu tư, giao dịch hay các loại khác do TradingView cung cấp hoặc xác nhận. Đọc thêm tại Điều khoản Sử dụng.