OPEN-SOURCE SCRIPT
Cumulative Force Oscillator with MACD
Cumulative Force Oscillator with MACD
The Cumulative Force Oscillator with MACD is an advanced technical indicator designed to provide traders with a unique perspective on market momentum and trend strength. By combining the power of cumulative candle force analysis with MACD crossover signals, this indicator offers a multifaceted approach to market analysis.
Key Features
1. Cumulative Force Calculation**: Measures the net force of price movements over a specified number of candles.
2. MACD Integration**: Incorporates MACD crossover signals for additional trend confirmation.
3. Visual Cues**: Utilizes color-coded oscillator lines and background zones for easy interpretation.
4. **Dynamic Labeling**: Displays real-time force values and percentage changes.
How It Works
Cumulative Force Calculation
The indicator calculates the "force" of each candle by subtracting the open price from the close price. It then sums this force over a user-defined number of candles to create a cumulative force value. This value oscillates above and below zero, indicating bullish or bearish pressure respectively.
MACD Crossover Detection
The indicator uses the standard MACD (12, 26, 9) to detect bullish and bearish crossovers. These crossovers are visually represented by colored background zones, providing an additional layer of trend confirmation.
Visual Representation
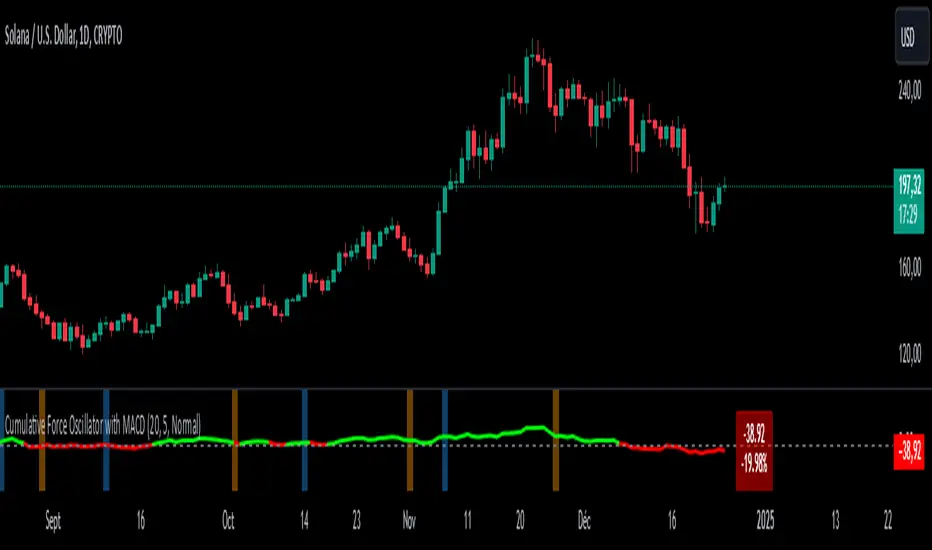
- The main oscillator line is plotted in green when above zero (bullish) and red when below zero (bearish).
- Background colors change based on MACD crossovers: light blue for bullish crossovers and light orange for bearish crossovers.
- A dynamic label displays the current cumulative force value and its percentage change from the previous period.
Interpretation
1. Oscillator Line : When the line is above zero, it indicates net bullish pressure; below zero suggests net bearish pressure.
2. Oscillator Momentum : The steepness and direction of the oscillator line indicate the strength and direction of the current market force.
3. MACD Crossovers : Blue background zones suggest potential bullish trends, while orange zones indicate potential bearish trends.
4. Divergences : Look for divergences between the oscillator and price action for potential trend reversal signals.
Customization
Users can customize several aspects of the indicator :
- Number of candles for force calculation
- Label offset and text size
- Color schemes (through code modification)
Conclusion
The Cumulative Force Oscillator with MACD is a versatile tool that combines momentum analysis with trend confirmation signals. By providing a visual representation of cumulative market force alongside MACD crossovers, it offers traders a comprehensive view of market dynamics. This indicator can be particularly useful for identifying potential trend reversals, confirming existing trends, and gauging overall market strength.
The Cumulative Force Oscillator with MACD is an advanced technical indicator designed to provide traders with a unique perspective on market momentum and trend strength. By combining the power of cumulative candle force analysis with MACD crossover signals, this indicator offers a multifaceted approach to market analysis.
Key Features
1. Cumulative Force Calculation**: Measures the net force of price movements over a specified number of candles.
2. MACD Integration**: Incorporates MACD crossover signals for additional trend confirmation.
3. Visual Cues**: Utilizes color-coded oscillator lines and background zones for easy interpretation.
4. **Dynamic Labeling**: Displays real-time force values and percentage changes.
How It Works
Cumulative Force Calculation
The indicator calculates the "force" of each candle by subtracting the open price from the close price. It then sums this force over a user-defined number of candles to create a cumulative force value. This value oscillates above and below zero, indicating bullish or bearish pressure respectively.
MACD Crossover Detection
The indicator uses the standard MACD (12, 26, 9) to detect bullish and bearish crossovers. These crossovers are visually represented by colored background zones, providing an additional layer of trend confirmation.
Visual Representation
- The main oscillator line is plotted in green when above zero (bullish) and red when below zero (bearish).
- Background colors change based on MACD crossovers: light blue for bullish crossovers and light orange for bearish crossovers.
- A dynamic label displays the current cumulative force value and its percentage change from the previous period.
Interpretation
1. Oscillator Line : When the line is above zero, it indicates net bullish pressure; below zero suggests net bearish pressure.
2. Oscillator Momentum : The steepness and direction of the oscillator line indicate the strength and direction of the current market force.
3. MACD Crossovers : Blue background zones suggest potential bullish trends, while orange zones indicate potential bearish trends.
4. Divergences : Look for divergences between the oscillator and price action for potential trend reversal signals.
Customization
Users can customize several aspects of the indicator :
- Number of candles for force calculation
- Label offset and text size
- Color schemes (through code modification)
Conclusion
The Cumulative Force Oscillator with MACD is a versatile tool that combines momentum analysis with trend confirmation signals. By providing a visual representation of cumulative market force alongside MACD crossovers, it offers traders a comprehensive view of market dynamics. This indicator can be particularly useful for identifying potential trend reversals, confirming existing trends, and gauging overall market strength.
Mã nguồn mở
Theo đúng tinh thần TradingView, tác giả của tập lệnh này đã công bố nó dưới dạng mã nguồn mở, để các nhà giao dịch có thể xem xét và xác minh chức năng. Chúc mừng tác giả! Mặc dù bạn có thể sử dụng miễn phí, hãy nhớ rằng việc công bố lại mã phải tuân theo Nội quy.
Thông báo miễn trừ trách nhiệm
Thông tin và các ấn phẩm này không nhằm mục đích, và không cấu thành, lời khuyên hoặc khuyến nghị về tài chính, đầu tư, giao dịch hay các loại khác do TradingView cung cấp hoặc xác nhận. Đọc thêm tại Điều khoản Sử dụng.