OPEN-SOURCE SCRIPT
Custom Support & Resistance Levels
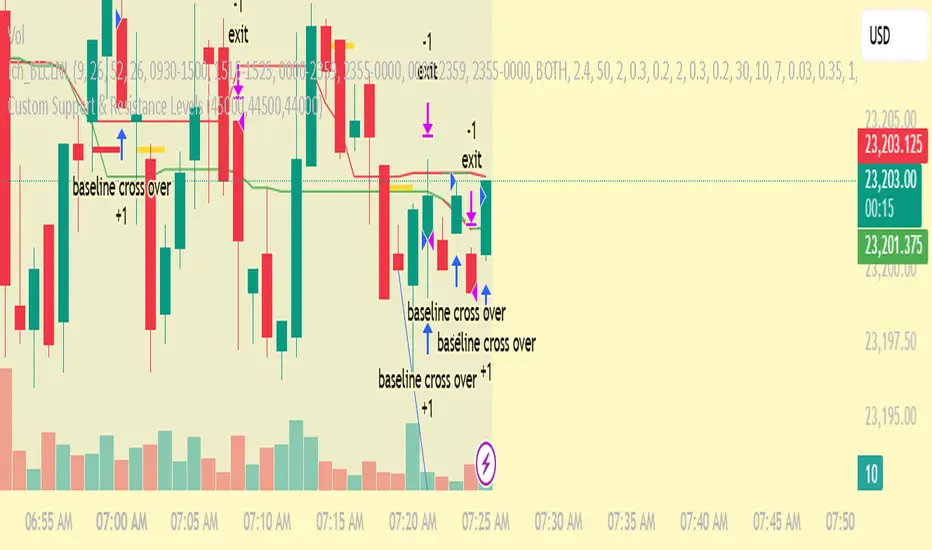
The Smart Auto Trendline Indicator is designed to help traders quickly identify key market trends without the need for manual drawing. It automatically detects swing highs and lows, plots dynamic trendlines, and updates them in real-time as price evolves.
This tool is especially useful for traders who rely on trendline breakouts, pullback entries, or reversal confirmations. By simplifying chart analysis, it saves time and ensures more consistent results.
Key Features:
🔹 Automatic detection of valid swing highs and lows
🔹 Dynamic trendline plotting (auto-adjusts as price moves)
🔹 Highlights potential breakout and breakdown zones
🔹 Works on all timeframes and instruments (Forex, Stocks, Indices, Crypto)
🔹 Clean, non-intrusive design to keep charts clear
🔹 Customizable settings (line color, style, sensitivity)
How to Use:
Apply the indicator to your chart.
Observe automatically drawn trendlines.
Watch for breakouts above/below trendlines for trade entries.
Use in combination with other tools like RSI, MACD, or support/resistance for stronger confirmation.
Best For:
Breakout traders
Swing traders
Trend followers
Forex, Stocks, Crypto, Indices
Mã nguồn mở
Theo đúng tinh thần TradingView, tác giả của tập lệnh này đã công bố nó dưới dạng mã nguồn mở, để các nhà giao dịch có thể xem xét và xác minh chức năng. Chúc mừng tác giả! Mặc dù bạn có thể sử dụng miễn phí, hãy nhớ rằng việc công bố lại mã phải tuân theo Nội quy.
Thông báo miễn trừ trách nhiệm
Thông tin và các ấn phẩm này không nhằm mục đích, và không cấu thành, lời khuyên hoặc khuyến nghị về tài chính, đầu tư, giao dịch hay các loại khác do TradingView cung cấp hoặc xác nhận. Đọc thêm tại Điều khoản Sử dụng.