OPEN-SOURCE SCRIPT
HTF Candle Support & Resistance «NoaTrader»
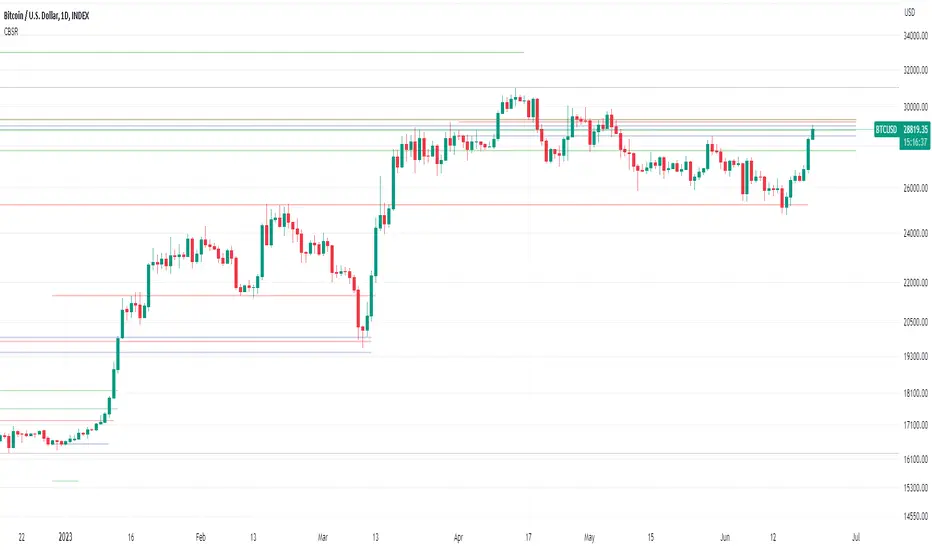
This script uses higher timeframe candle's High, Low & Close as a source for drawing a line representing potential Supports and Resistances.
The more lines you see on a level, probably the more important that level is.
The script has a single input for setting the source candle's timeframe, so it can be used on any timeframe with the proper settings. For example, higher timeframes like weekly and monthly can use "3M" or "12M" settings, Daily timeframes with "W", or even lower timeframes like minutes and seconds with "240" and "60" (M means monthly candle, W is weekly, and numbers are for minutes.)
As you can see on the code:
Give it a try on different timeframes with different settings to see interesting gaps between lines!
The more lines you see on a level, probably the more important that level is.
The script has a single input for setting the source candle's timeframe, so it can be used on any timeframe with the proper settings. For example, higher timeframes like weekly and monthly can use "3M" or "12M" settings, Daily timeframes with "W", or even lower timeframes like minutes and seconds with "240" and "60" (M means monthly candle, W is weekly, and numbers are for minutes.)
As you can see on the code:
- Red lines represent candle's High.
- Green lines represent candle's Low.
- Blue lines represent candle's Close.
Give it a try on different timeframes with different settings to see interesting gaps between lines!
Mã nguồn mở
Theo đúng tinh thần TradingView, tác giả của tập lệnh này đã công bố nó dưới dạng mã nguồn mở, để các nhà giao dịch có thể xem xét và xác minh chức năng. Chúc mừng tác giả! Mặc dù bạn có thể sử dụng miễn phí, hãy nhớ rằng việc công bố lại mã phải tuân theo Nội quy.
Thông báo miễn trừ trách nhiệm
Thông tin và các ấn phẩm này không nhằm mục đích, và không cấu thành, lời khuyên hoặc khuyến nghị về tài chính, đầu tư, giao dịch hay các loại khác do TradingView cung cấp hoặc xác nhận. Đọc thêm tại Điều khoản Sử dụng.