OPEN-SOURCE SCRIPT
Cập nhật O'Neil Earnings Stability
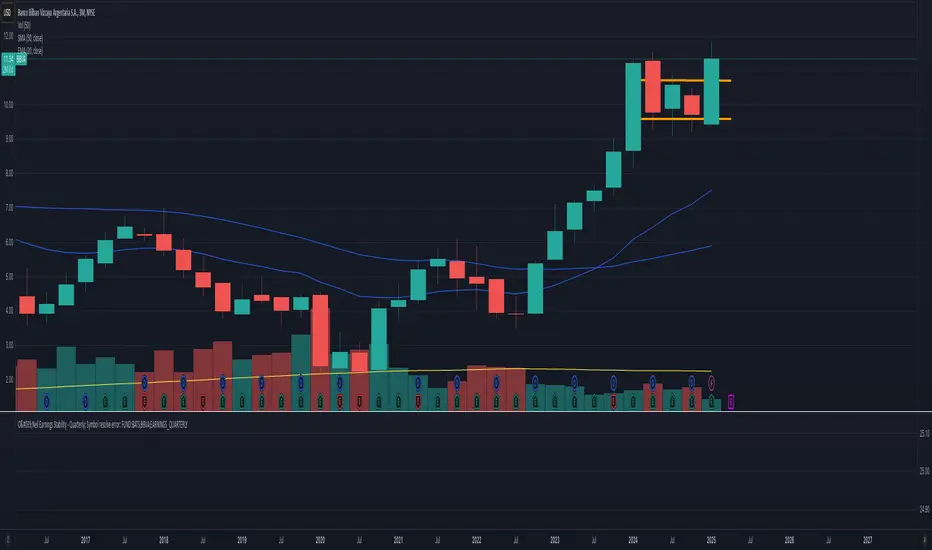
O'Neil Earnings Stability Indicator
This indicator implements William O'Neil's earnings stability analysis, a key factor in identifying high-quality growth stocks. It measures both earnings stability (1-99 scale) and growth rate.
Scale Interpretation:
• 1-25: Highly stable earnings (ideal)
• 26-30: Moderately stable
• >30: More cyclical/less dependable
The stability score is calculated by measuring deviations from the earnings trend line, with lower scores indicating more consistent growth. Combined with the annual growth rate (target ≥25%), this helps identify stocks with both steady and strong earnings growth.
Optimal Criteria:
✓ Stability Score < 25
✓ Annual Growth > 25%
This tool helps filter out stocks with erratic earnings patterns and identify those with proven, sustainable growth records. Green label indicates both criteria are met; red indicates one or both criteria failed."
Would you like me to modify any part of this description or add more details about specific aspects of the calculation?
The key concepts in these calculations:
Stability Score (1-99 scale):
Lower score = more stable
Takes average deviation from mean earnings
Uses logarithmic scaling to emphasize smaller deviations
Multiplies by 20 to get into 1-99 range
Score ≤ 25 meets O'Neil's criteria
Growth Rate:
Year-over-year comparison (current quarter vs same quarter last year)
Calculated as percentage change
Growth ≥ 25% meets O'Neil's criteria
O'Neil's Combined Criteria:
Stability Score should be ≤ 25 (indicating stable earnings)
Growth Rate should be ≥ 25% (indicating strong growth)
Both must be met for ideal conditions
Phát hành các Ghi chú
- updating script to stay static with earnings calculations not based on intervals selectedMã nguồn mở
Theo đúng tinh thần TradingView, tác giả của tập lệnh này đã công bố nó dưới dạng mã nguồn mở, để các nhà giao dịch có thể xem xét và xác minh chức năng. Chúc mừng tác giả! Mặc dù bạn có thể sử dụng miễn phí, hãy nhớ rằng việc công bố lại mã phải tuân theo Nội quy.
Thông báo miễn trừ trách nhiệm
Thông tin và các ấn phẩm này không nhằm mục đích, và không cấu thành, lời khuyên hoặc khuyến nghị về tài chính, đầu tư, giao dịch hay các loại khác do TradingView cung cấp hoặc xác nhận. Đọc thêm tại Điều khoản Sử dụng.
Mã nguồn mở
Theo đúng tinh thần TradingView, tác giả của tập lệnh này đã công bố nó dưới dạng mã nguồn mở, để các nhà giao dịch có thể xem xét và xác minh chức năng. Chúc mừng tác giả! Mặc dù bạn có thể sử dụng miễn phí, hãy nhớ rằng việc công bố lại mã phải tuân theo Nội quy.
Thông báo miễn trừ trách nhiệm
Thông tin và các ấn phẩm này không nhằm mục đích, và không cấu thành, lời khuyên hoặc khuyến nghị về tài chính, đầu tư, giao dịch hay các loại khác do TradingView cung cấp hoặc xác nhận. Đọc thêm tại Điều khoản Sử dụng.