OPEN-SOURCE SCRIPT
Depth Trend Indicator - RSI
Depth Trend Indicator - RSI
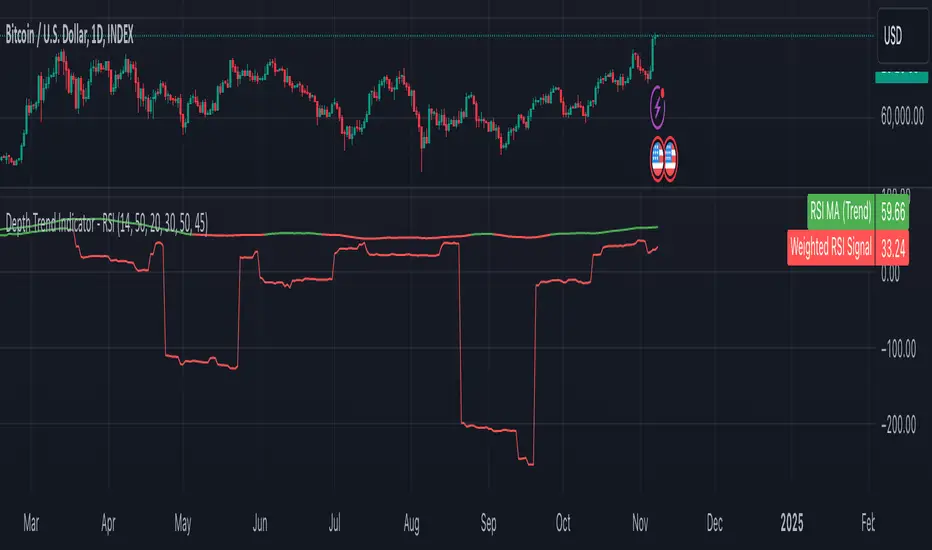
This indicator is designed to identify trends and gauge pullback strength by combining the power of RSI and moving averages with a depth-weighted calculation. The script was created by me, Nathan Farmer and is based on a multi-step process to determine trend strength and direction, adjusted by a "depth" factor for more accurate signal analysis.
How It Works
Key Parameters
Notes:
As always, backtest this indicator and modify the parameters as needed for your specific asset, over your specific timeframe. I chose these defaults as they worked well on the assets I look at, but it is likely you tend to look at a different group of assets over a different timeframe than what I do.
Large pullbacks can create large downward spikes in the weighted line. This isn't graphically pleasing, but I have tested it with various methods of normalization and smoothing and found the simple smoothing used in the indicator to be best despite this.
This indicator is designed to identify trends and gauge pullback strength by combining the power of RSI and moving averages with a depth-weighted calculation. The script was created by me, Nathan Farmer and is based on a multi-step process to determine trend strength and direction, adjusted by a "depth" factor for more accurate signal analysis.
How It Works
- Trend Definition Using RSI: The RSI Moving Average (rsiMa) is calculated to assess the current trend, using customizable parameters for the RSI Period and MA Period.
- Trends are defined as follows:
Uptrend: RSI MA > Critical RSI Value
Downtrend: RSI MA < Critical RSI Value - Pullback Depth Calculation: To measure pullback strength relative to the current trend, the indicator calculates a Depth Percentage. This is defined as the portion of the gap between the moving average and the price covered by a pullback.
- Depth-Weighted RSI Calculation: The Depth Percentage is then applied as a weighting factor on the RSI Moving Average, giving us a Weighted RSI line that adjusts to the depth of pullbacks. This line is rather noisy, and as such we take a moving average to smooth out some of the noise.
Key Parameters
- RSI Period: The period for RSI calculation.
- MA Period: The moving average period applied to RSI.
- Price MA Period: Determines the SMA period for price, used to calculate pullback depth.
- Smoothing Length: Length of smoothing applied to the weighted RSI, creating a more stable signal.
- RSI Critical Value: The critical value (level) used in determining whether we're in an uptrend or a downtrend.
- Depth Critical Value: The critical value (level) used in determining whether or not the depth weighted value confirms the state of a trend.
Notes:
As always, backtest this indicator and modify the parameters as needed for your specific asset, over your specific timeframe. I chose these defaults as they worked well on the assets I look at, but it is likely you tend to look at a different group of assets over a different timeframe than what I do.
Large pullbacks can create large downward spikes in the weighted line. This isn't graphically pleasing, but I have tested it with various methods of normalization and smoothing and found the simple smoothing used in the indicator to be best despite this.
Mã nguồn mở
Theo đúng tinh thần TradingView, tác giả của tập lệnh này đã công bố nó dưới dạng mã nguồn mở, để các nhà giao dịch có thể xem xét và xác minh chức năng. Chúc mừng tác giả! Mặc dù bạn có thể sử dụng miễn phí, hãy nhớ rằng việc công bố lại mã phải tuân theo Nội quy.
Thông báo miễn trừ trách nhiệm
Thông tin và các ấn phẩm này không nhằm mục đích, và không cấu thành, lời khuyên hoặc khuyến nghị về tài chính, đầu tư, giao dịch hay các loại khác do TradingView cung cấp hoặc xác nhận. Đọc thêm tại Điều khoản Sử dụng.