OPEN-SOURCE SCRIPT
Normalized ROC²
Normalized Rate of Change of Rate of Change (ROC²) Histogram
Overview
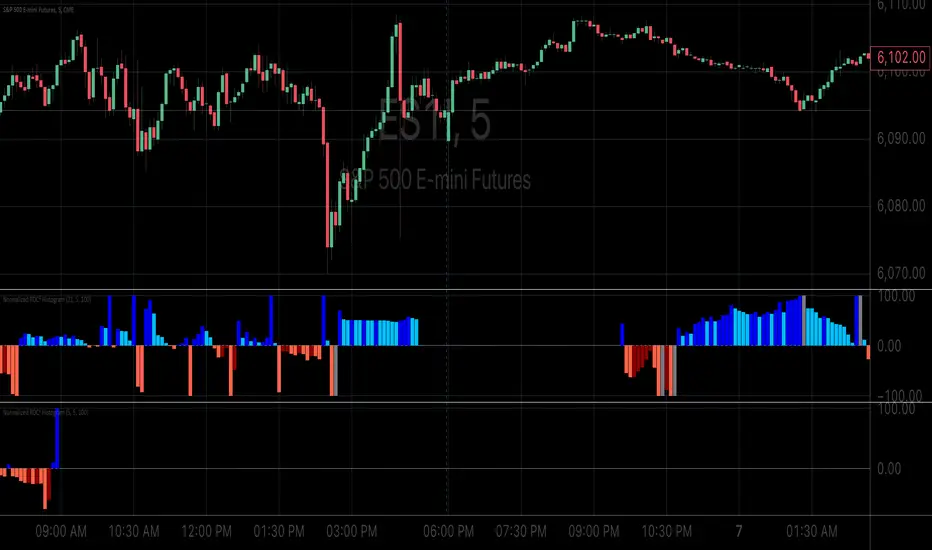
The Normalized ROC² Histogram is a momentum-based indicator designed to detect potential trend reversals by measuring the rate of change of the rate of change of price (the second derivative of price movement). This provides insight into when momentum is slowing down, signaling that a price reversal may be approaching.
The indicator also dynamically changes color to highlight shifts in momentum strength, allowing traders to visualize when price acceleration is increasing or decreasing.
How It Works
🔹 Zero Line Crossovers → Potential Direction Change
• When the histogram approaches zero and crosses over, it suggests that price momentum is shifting and a reversal may be imminent.
• Positive to Negative Crossover: Bearish momentum shift.
• Negative to Positive Crossover: Bullish momentum shift.
🔹 Momentum Strength Visualization → Color Shift
• Dark Blue (⬆️ Increasing Positive Momentum) → Price is accelerating upward.
• Light Blue (🔽 Decreasing Positive Momentum) → Uptrend is weakening.
• Dark Red (⬇️ Increasing Negative Momentum) → Price is accelerating downward.
• Light Red (🔼 Decreasing Negative Momentum) → Downtrend is weakening.
🔹 Normalization for Cleaner Visualization
• Prevents extreme volatility spikes from distorting the histogram.
• Normalizes values on a 0 to 100 scale, ensuring consistent bar height.
How to Use It
✅ Watch for Crossovers Near Zero → These can indicate a trend reversal is forming.
✅ Observe Color Changes → A shift from dark to light signals a deceleration, which often precedes price turning points.
✅ Combine with Other Indicators → Works well with Volume Profile, Moving Averages, and Market Structure analysis.
Why This Indicator is Unique
🚀 Second-derivative momentum detection → Provides early insight into potential price shifts.
📊 Normalized bars prevent distortion → No more extreme spikes ruining the scale.
🎯 Color-coded visual cues → Instantly see when momentum is gaining or fading.
📌 Add the Normalized ROC² Histogram to your charts today to detect potential reversals and momentum shifts in real-time! 🚀
Overview
The Normalized ROC² Histogram is a momentum-based indicator designed to detect potential trend reversals by measuring the rate of change of the rate of change of price (the second derivative of price movement). This provides insight into when momentum is slowing down, signaling that a price reversal may be approaching.
The indicator also dynamically changes color to highlight shifts in momentum strength, allowing traders to visualize when price acceleration is increasing or decreasing.
How It Works
🔹 Zero Line Crossovers → Potential Direction Change
• When the histogram approaches zero and crosses over, it suggests that price momentum is shifting and a reversal may be imminent.
• Positive to Negative Crossover: Bearish momentum shift.
• Negative to Positive Crossover: Bullish momentum shift.
🔹 Momentum Strength Visualization → Color Shift
• Dark Blue (⬆️ Increasing Positive Momentum) → Price is accelerating upward.
• Light Blue (🔽 Decreasing Positive Momentum) → Uptrend is weakening.
• Dark Red (⬇️ Increasing Negative Momentum) → Price is accelerating downward.
• Light Red (🔼 Decreasing Negative Momentum) → Downtrend is weakening.
🔹 Normalization for Cleaner Visualization
• Prevents extreme volatility spikes from distorting the histogram.
• Normalizes values on a 0 to 100 scale, ensuring consistent bar height.
How to Use It
✅ Watch for Crossovers Near Zero → These can indicate a trend reversal is forming.
✅ Observe Color Changes → A shift from dark to light signals a deceleration, which often precedes price turning points.
✅ Combine with Other Indicators → Works well with Volume Profile, Moving Averages, and Market Structure analysis.
Why This Indicator is Unique
🚀 Second-derivative momentum detection → Provides early insight into potential price shifts.
📊 Normalized bars prevent distortion → No more extreme spikes ruining the scale.
🎯 Color-coded visual cues → Instantly see when momentum is gaining or fading.
📌 Add the Normalized ROC² Histogram to your charts today to detect potential reversals and momentum shifts in real-time! 🚀
Mã nguồn mở
Theo đúng tinh thần TradingView, tác giả của tập lệnh này đã công bố nó dưới dạng mã nguồn mở, để các nhà giao dịch có thể xem xét và xác minh chức năng. Chúc mừng tác giả! Mặc dù bạn có thể sử dụng miễn phí, hãy nhớ rằng việc công bố lại mã phải tuân theo Nội quy.
I provide expert guidance for crypto traders using Volume Profile and pattern recognition tech
Thông báo miễn trừ trách nhiệm
Thông tin và các ấn phẩm này không nhằm mục đích, và không cấu thành, lời khuyên hoặc khuyến nghị về tài chính, đầu tư, giao dịch hay các loại khác do TradingView cung cấp hoặc xác nhận. Đọc thêm tại Điều khoản Sử dụng.