OPEN-SOURCE SCRIPT
Total Return (divi reivested)
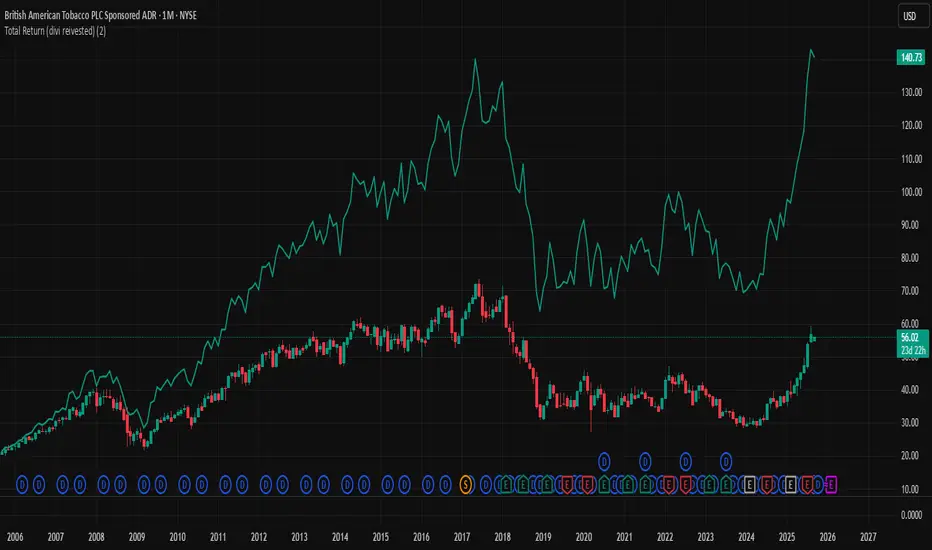
Total Return (Dividends Reinvested) — Price Scale
This indicator overlays a Total Return price line on the chart. It shows how the stock would have performed if all dividends had been reinvested back into the stock (buying fractional shares) rather than taken as cash.
The line starts exactly at the price level of the first visible bar on your chart and moves in the same price units as the chart (not indexed to 100).
Until the first dividend inside the visible window, the Total Return line is identical to the price. From the first dividend onward, it gradually diverges upwards, reflecting the effect of reinvested payouts.
Settings:
Reinvest at Open / Close — Choose whether reinvestment uses the bar’s open or close price.
Apply effect on the next bar — If enabled, reinvestment shows up from the bar after the dividend date (common in practice).
Show dividend markers — Optionally plots labels where dividend events occur.
Line width — Adjusts the thickness of the plotted Total Return line.
Use case:
This tool is useful if you want to compare plain price performance with true shareholder returns including dividends. It helps evaluate dividend stocks (like BTI, T, XOM, etc.) more realistically.
Mã nguồn mở
Theo đúng tinh thần TradingView, tác giả của tập lệnh này đã công bố nó dưới dạng mã nguồn mở, để các nhà giao dịch có thể xem xét và xác minh chức năng. Chúc mừng tác giả! Mặc dù bạn có thể sử dụng miễn phí, hãy nhớ rằng việc công bố lại mã phải tuân theo Nội quy.
Thông báo miễn trừ trách nhiệm
Thông tin và các ấn phẩm này không nhằm mục đích, và không cấu thành, lời khuyên hoặc khuyến nghị về tài chính, đầu tư, giao dịch hay các loại khác do TradingView cung cấp hoặc xác nhận. Đọc thêm tại Điều khoản Sử dụng.