OPEN-SOURCE SCRIPT
DMI + ADX + Key Level NACHOMIXCRYPTO
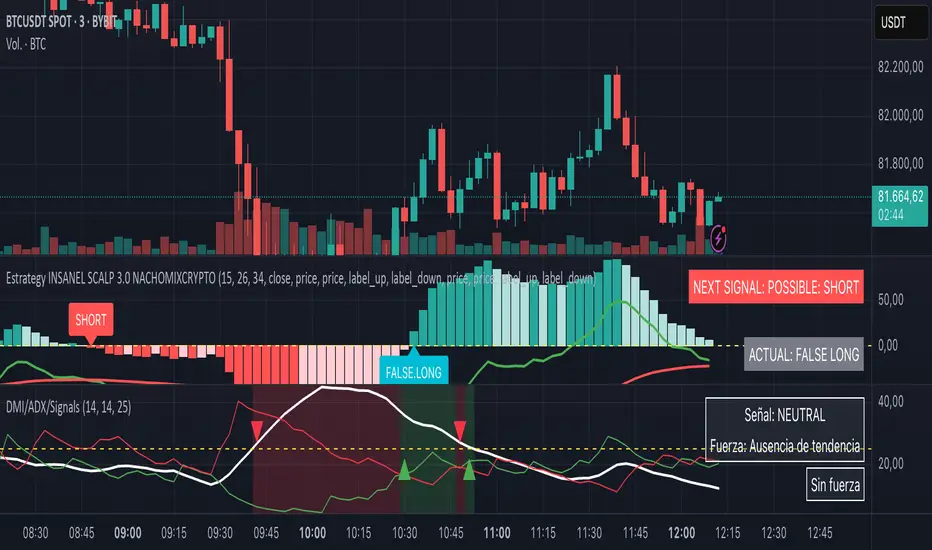
The DMI + ADX + Key Level NACHOMIXCRYPTO indicator is a technical analysis tool that combines the Directional Movement Index (DMI) and the Average Directional Index (ADX) to assess trend strength and direction. It also includes customizable key levels for better visualization.
Components:
ADX (Average Directional Index):
Measures the strength of a trend, regardless of its direction.
Values below 25 indicate a weak trend or range-bound market.
Values between 25-50 suggest a strong trend.
Values between 50-75 indicate a very strong trend.
Values above 75 represent an extremely strong trend.
+DI (Positive Directional Indicator) and -DI (Negative Directional Indicator):
+DI indicates bullish strength, shown in green.
-DI indicates bearish strength, shown in red.
The comparison between these two lines helps determine the market direction.
Features:
Trend Detection:
When +DI is above -DI and ADX is above the key level, it signals a bullish trend.
When -DI is above +DI and ADX is above the key level, it signals a bearish trend.
Key Level Line:
A customizable horizontal line that marks the threshold for trend strength.
Trend Background Color:
Green for strong uptrends and red for strong downtrends.
Signal Arrows:
A green upward triangle is plotted when a new bullish trend starts.
A red downward triangle is plotted when a new bearish trend starts.
Trend Strength Labels:
The indicator displays the current market strength classification and whether the trend is bullish, bearish, or neutral.
Strength Analysis Table:
Provides insights on whether the market has bullish, bearish, mixed strength, or no strength at all.
This indicator is particularly useful for traders looking to identify strong trends and catch early trend reversals.
Mã nguồn mở
Theo đúng tinh thần TradingView, tác giả của tập lệnh này đã công bố nó dưới dạng mã nguồn mở, để các nhà giao dịch có thể xem xét và xác minh chức năng. Chúc mừng tác giả! Mặc dù bạn có thể sử dụng miễn phí, hãy nhớ rằng việc công bố lại mã phải tuân theo Nội quy.
Thông báo miễn trừ trách nhiệm
Thông tin và các ấn phẩm này không nhằm mục đích, và không cấu thành, lời khuyên hoặc khuyến nghị về tài chính, đầu tư, giao dịch hay các loại khác do TradingView cung cấp hoặc xác nhận. Đọc thêm tại Điều khoản Sử dụng.