OPEN-SOURCE SCRIPT
MSTR vs BTCUSD % Movement Comparison
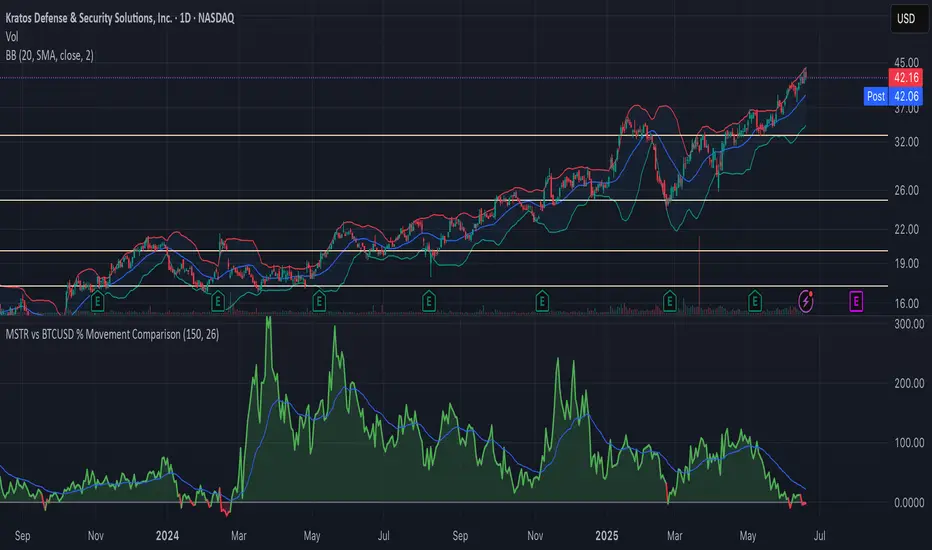
The indicator, in its current form, is a custom Pine Script (version 6) tool named "MSTR vs BTCUSD % Movement Comparison" that visually compares the percentage price movements of MicroStrategy (MSTR) and Bitcoin (BTCUSD) over a user-defined lookback period. It plots the difference in their percentage changes (diff_pct = mstr_pct - btcusd_pct) as a line, with a zero line for reference, and uses green/red coloring to indicate whether MSTR is outperforming (green, above zero) or underperforming (red, below zero) BTCUSD. The area between the difference line and zero line is filled with semi-transparent green or red for clarity. Additionally, an adjustable-period Exponential Moving Average (EMA) of the percentage difference smooths the trend, helping identify momentum shifts. The indicator is fixed to compare MSTR and BTCUSD, ensuring consistent output regardless of the chart’s active symbol (e.g., MSTR, MTPLF, or others).
Key Features:
Percentage Difference: Shows MSTR’s percentage change minus BTCUSD’s, highlighting relative performance.
Zero Line: A gray solid line at 0 for reference.
Color Coding: Green line/fill when MSTR outperforms, red when it underperforms.
Adjustable EMA: User-defined EMA period (default: 26) smooths the percentage difference.
Fixed Comparison: Always compares MSTR vs. BTCUSD, unaffected by the chart’s symbol.
User Inputs: Lookback period (default: 50 bars) and EMA period (default: 26) are customizable.
Example: On a 1-hour chart, if MSTR rises 4% and BTCUSD rises 1% over 50 bars, the difference line plots at +3 (green) with green fill, and the 26-period EMA might be at +2.2, indicating MSTR’s outperformance trend.
Mã nguồn mở
Theo đúng tinh thần TradingView, tác giả của tập lệnh này đã công bố nó dưới dạng mã nguồn mở, để các nhà giao dịch có thể xem xét và xác minh chức năng. Chúc mừng tác giả! Mặc dù bạn có thể sử dụng miễn phí, hãy nhớ rằng việc công bố lại mã phải tuân theo Nội Quy.
Thông báo miễn trừ trách nhiệm
Thông tin và các ấn phẩm này không nhằm mục đích, và không cấu thành, lời khuyên hoặc khuyến nghị về tài chính, đầu tư, giao dịch hay các loại khác do TradingView cung cấp hoặc xác nhận. Đọc thêm tại Điều khoản Sử dụng.