PROTECTED SOURCE SCRIPT
Phase Accumulate/Manipulate/Distribute - NY [nainoa_invest]
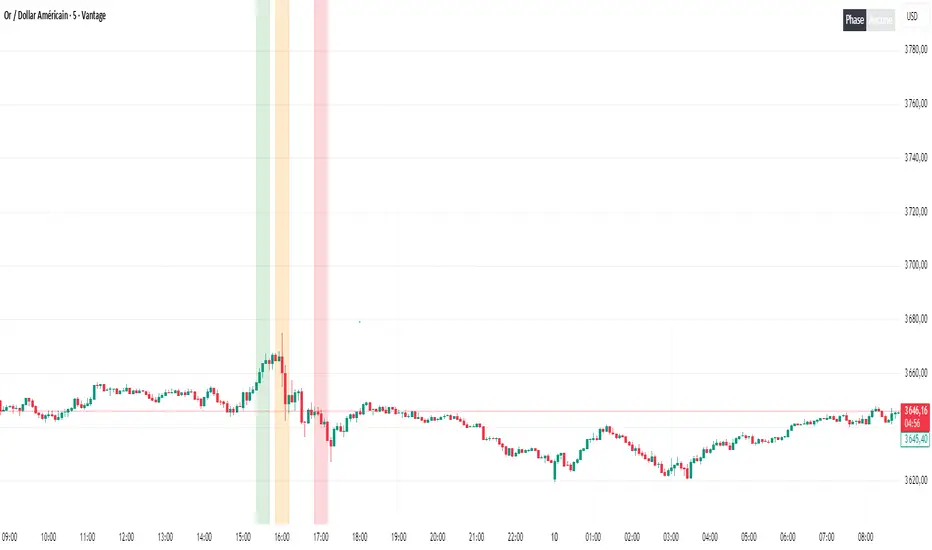
This TradingView script allows you to identify and visualize the different phases of an asset in the New York market (EST/GMT-4): Accumulation, Manipulation, and Distribution.
Key Features:
Phase Visualization on Chart: Each phase is displayed as a colored rectangle (green for accumulation, orange for manipulation, red for distribution) to easily track market movements.
Dynamic Dashboard: A table shows the current phase in real-time directly on the chart, with customizable colors.
Customizable Settings: You can adjust phase colors, dashboard position and size, and border style.
Precise Time Windows: Phases are automatically calculated based on specific NY session hours for better market behavior tracking.
This script is ideal for traders who want to quickly identify key market phases and make more informed trading decisions.
If you want to use this script, you can contact me directly.
Mã được bảo vệ
Tập lệnh này được đăng dưới dạng mã nguồn đóng. Tuy nhiên, bạn có thể tự do sử dụng tập lệnh mà không có bất kỳ hạn chế nào – tìm hiểu thêm tại đây.
Thông báo miễn trừ trách nhiệm
Thông tin và ấn phẩm không có nghĩa là và không cấu thành, tài chính, đầu tư, kinh doanh, hoặc các loại lời khuyên hoặc khuyến nghị khác được cung cấp hoặc xác nhận bởi TradingView. Đọc thêm trong Điều khoản sử dụng.