OPEN-SOURCE SCRIPT
Earnings Beat Indicator
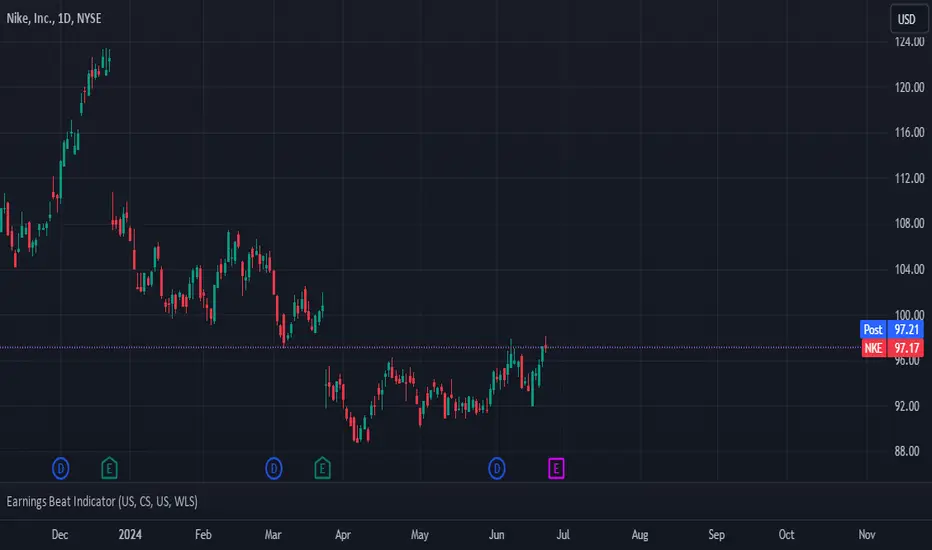
This indicator seeks to predict whether a stock will beat or miss earnings by forecasting revenues, and subsequently net income, using linear regression. The y-values of this regression are revenues and the x-axis is an economic series of your choosing. Double-click the status line (the words "US" and "GDP") to change economic datasets. The full list of economic datasets available in TradingView is in the Help Center.
Instructions:
1. Double-click on the status line (the fields "US" and "GDP"). The inputs tab will pop up.
2. Type in the country and data codes for the economic datasets you believe have the highest correlation with revenues and net margins respectively.
3. Check the correlation coefficient between financial data and economic data by interpreting the white and gray numbers on the status line - white for the correlation coefficient between revenues and your chosen economic dataset, and gray for the correlation coefficient between net margins and your chosen economic dataset. These numbers should be as close to +1 or -1 as possible.
4. Interpret the results - the blue number indicates whether revenues will beat estimates and the green number indicates whether earnings will beat estimates. A 1 for both outputs indicates a double beat, a 1 and a 0 indicates a revenue beat but not an earnings beat, a 0 and a 1 indicates an earnings beat but not a revenue beat, and a 0 and a 0 indicates a double miss.
- DickZhones
Mã nguồn mở
Theo đúng tinh thần TradingView, tác giả của tập lệnh này đã công bố nó dưới dạng mã nguồn mở, để các nhà giao dịch có thể xem xét và xác minh chức năng. Chúc mừng tác giả! Mặc dù bạn có thể sử dụng miễn phí, hãy nhớ rằng việc công bố lại mã phải tuân theo Nội quy.
Thông báo miễn trừ trách nhiệm
Thông tin và các ấn phẩm này không nhằm mục đích, và không cấu thành, lời khuyên hoặc khuyến nghị về tài chính, đầu tư, giao dịch hay các loại khác do TradingView cung cấp hoặc xác nhận. Đọc thêm tại Điều khoản Sử dụng.