OPEN-SOURCE SCRIPT
Coppock Curve
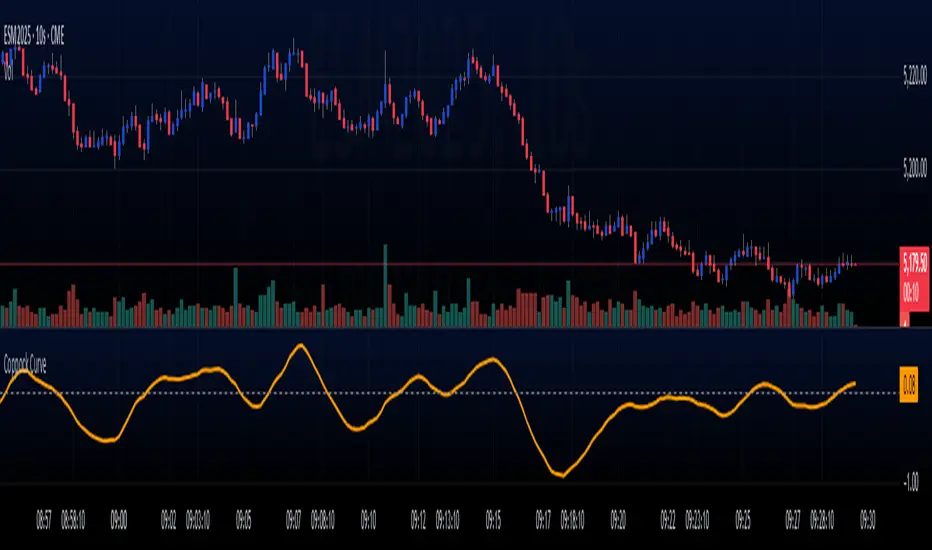
The Coppock Curve is a long-term momentum indicator, also known as the "Coppock Guide," used to identify potential long-term market turning points, particularly major downturns and upturns, by smoothing the sum of 14-month and 11-month rates of change with a 10-month weighted moving average.
Here's a more detailed breakdown:
What it is:
The Coppock Curve is a technical indicator designed to identify long-term buy and sell signals in major stock market indices and related ETFs.
How it's calculated:
Rate of Change (ROC): The indicator starts by calculating the rate of change (ROC) for 14 and 11 periods (usually months).
Sum of ROCs: The ROC for the 14-period and 11-period are summed.
Weighted Moving Average (WMA): A 10-period weighted moving average (WMA) is then applied to the sum of the ROCs.
Interpreting the Curve:
Buy Signals: A buy signal is often generated when the Coppock Curve crosses above the zero line, suggesting a potential transition from a bearish to a bullish phase.
Sell Signals: While primarily designed to identify market bottoms, some traders may interpret a cross below the zero line as a sell signal or a bearish warning.
Origin and Purpose:
The Coppock Curve was introduced by economist Edwin Coppock in 1962.
It was originally designed to help investors identify opportune moments to enter the market.
Coppock's inspiration came from the Episcopal Church's concept of the average mourning period, which he believed mirrored the stock market's recovery period.
Limitations:
The Coppock Curve is primarily used for long-term analysis and may not be as effective for short-term or intraday trading.
It may lag in rapidly changing markets, and its signals may not always be reliable.
Mã nguồn mở
Theo đúng tinh thần TradingView, tác giả của tập lệnh này đã công bố nó dưới dạng mã nguồn mở, để các nhà giao dịch có thể xem xét và xác minh chức năng. Chúc mừng tác giả! Mặc dù bạn có thể sử dụng miễn phí, hãy nhớ rằng việc công bố lại mã phải tuân theo Nội quy.
Thông báo miễn trừ trách nhiệm
Thông tin và các ấn phẩm này không nhằm mục đích, và không cấu thành, lời khuyên hoặc khuyến nghị về tài chính, đầu tư, giao dịch hay các loại khác do TradingView cung cấp hoặc xác nhận. Đọc thêm tại Điều khoản Sử dụng.