OPEN-SOURCE SCRIPT
Multi-SMA Dashboard (10 SMAs)
Description:
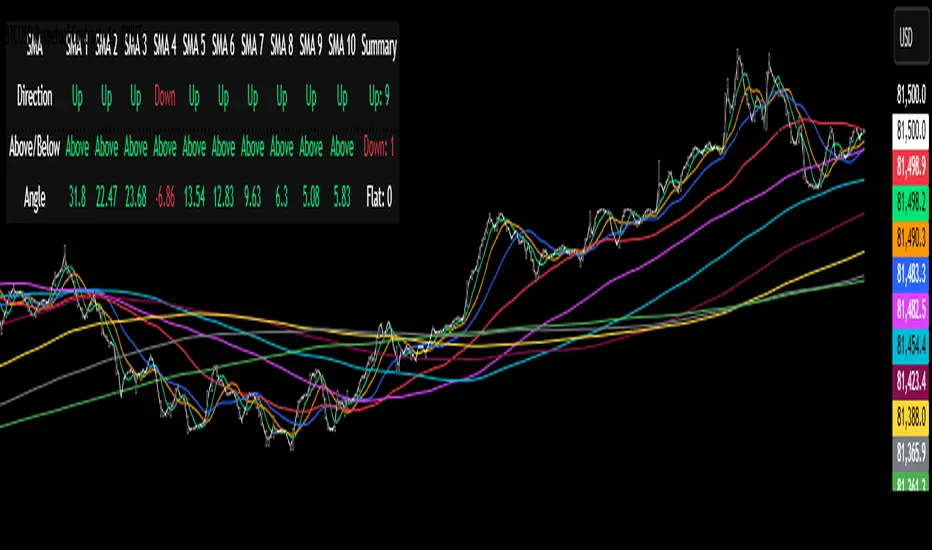
This script, "Multi-SMA Dashboard (10 SMAs)," creates a dashboard on a TradingView chart to analyze ten Simple Moving Averages (SMAs) of varying lengths. It overlays the chart and displays a table with each SMA’s direction, price position relative to the SMA, and angle of movement, providing a comprehensive trend overview.
How It Works:
1. **Inputs**: Users define lengths for 10 SMAs (default: 5, 10, 20, 50, 100, 150, 200, 250, 300, 350), select a price source (default: close), and customize table appearance and options like angle units (degrees/radians) and debug plots.
2. **SMA Calculation**: Computes 10 SMAs using the `ta.sma()` function with user-specified lengths and price source.
3. **Direction Determination**: The `sma_direction()` function checks each SMA’s trend:
- "Up" if current SMA > previous SMA.
- "Down" if current SMA < previous SMA.
- "Flat" if equal (no strength distinction).
4. **Price Position**: Compares the price source to each SMA, labeling it "Above" or "Below."
5. **Angle Calculation**: Tracks the most recent direction change point for each SMA and calculates its angle (atan of price change over time) in degrees or radians, based on the `showInRadians` toggle.
6. **Table Display**: A 12-column table shows:
- Columns 1-10: SMA name, direction (Up/Down/Flat), Above/Below status, and angle.
- Column 11: Summary of Up, Down, and Flat counts.
- Colors reflect direction (lime for Up/Above, red for Down/Below, white for Flat).
7. **Debug Option**: Optionally plots all SMAs and price for visual verification when `debug_plots_toggle` is enabled.
Indicators Used:
- Simple Moving Averages (SMAs): 10 user-configurable SMAs ranging from short-term (e.g., 5) to long-term (e.g., 350) periods.
The script runs continuously, updating the table on each bar, and overlays the chart to assist traders in assessing multi-timeframe trend direction and momentum without cluttering the view unless debug mode is active.
Mã nguồn mở
Theo đúng tinh thần TradingView, tác giả của tập lệnh này đã công bố nó dưới dạng mã nguồn mở, để các nhà giao dịch có thể xem xét và xác minh chức năng. Chúc mừng tác giả! Mặc dù bạn có thể sử dụng miễn phí, hãy nhớ rằng việc công bố lại mã phải tuân theo Nội quy.
Thông báo miễn trừ trách nhiệm
Thông tin và các ấn phẩm này không nhằm mục đích, và không cấu thành, lời khuyên hoặc khuyến nghị về tài chính, đầu tư, giao dịch hay các loại khác do TradingView cung cấp hoặc xác nhận. Đọc thêm tại Điều khoản Sử dụng.