OPEN-SOURCE SCRIPT
UM-Relative Strength Index with Trending EMA and Fill
Description
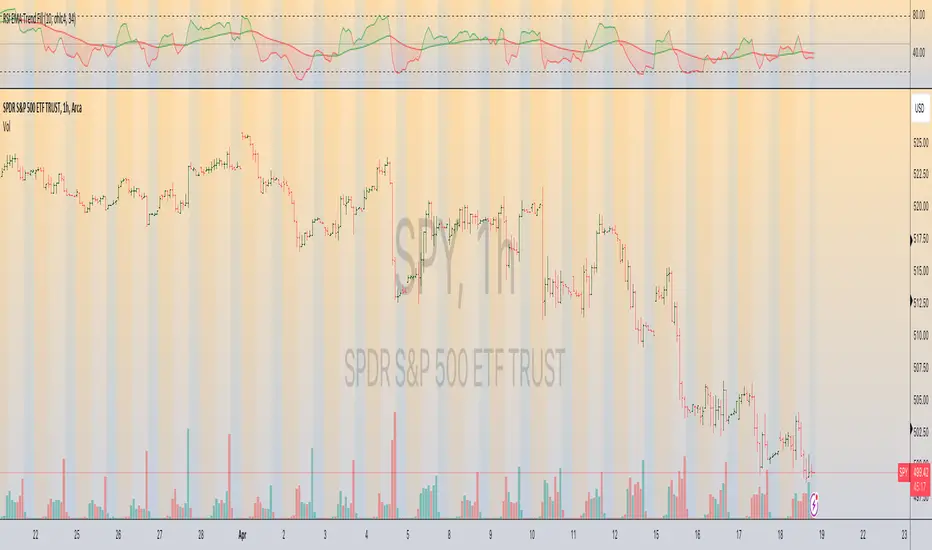
This is a different take on the traditional RSI - Relative Strength Index. This indicator turns the RSI line green when above 50 and red when below 50 making directional changes highly visual. Additionally, an exponential Moving Average is drawn of the RSI. The EMA is green when trending higher and red when trending lower. The area between the RSI and EMA lines are green when the RSI is above the RSI EMA and red when the RSI is below the EMA.
About
The RSI by itself is a good tool to determine trend with the colors. It can also be used to determined overbought and oversold extremes. The EMA of the RSI is a smoothing technique. The indicator can also be used to determine trend with the directional color changes.
Recommended Usage
I look for crossovers; bullish crossovers when the RSI crosses above the EMA AND the RSI crosses above 50. A bearish crossover is when the RSI crosses down through the EMA AND crosses below 50. It can also be used for trade confirmation; for example if the RSI EMA is green consider staying long. The indicator works on any timeframe and any security. I use it on smaller timeframes, 3 minute, 1 hour, and 3 hour, to better time entries/exits.
Default settings
The defaults are the author's preferred settings:
- RSI period is 10 using the open, high, low, and close for calculation. The additional data points using the OHLC give smoother effect.
- The EMA used by default is 34.
All parameters and colors are user-configurable.
Alerts
Alerts can be set on the indicator itself and/or alert on color changes of the EMA.
Helpful Hints:
Look for positive or negative crossovers.
Look for crosses above or below 50
Look for RSI divergences, for example if a security hits a new high, the RSI does not, this a sign of subtle weakness.
Draw trend lines on the RSI line. A violation of a recent trend line may indicate a change of trend for the security.
Mã nguồn mở
Theo đúng tinh thần TradingView, tác giả của tập lệnh này đã công bố nó dưới dạng mã nguồn mở, để các nhà giao dịch có thể xem xét và xác minh chức năng. Chúc mừng tác giả! Mặc dù bạn có thể sử dụng miễn phí, hãy nhớ rằng việc công bố lại mã phải tuân theo Nội quy.
David Franck
Thông báo miễn trừ trách nhiệm
Thông tin và các ấn phẩm này không nhằm mục đích, và không cấu thành, lời khuyên hoặc khuyến nghị về tài chính, đầu tư, giao dịch hay các loại khác do TradingView cung cấp hoặc xác nhận. Đọc thêm tại Điều khoản Sử dụng.