OPEN-SOURCE SCRIPT
TOTAL:(RSI+TSI)
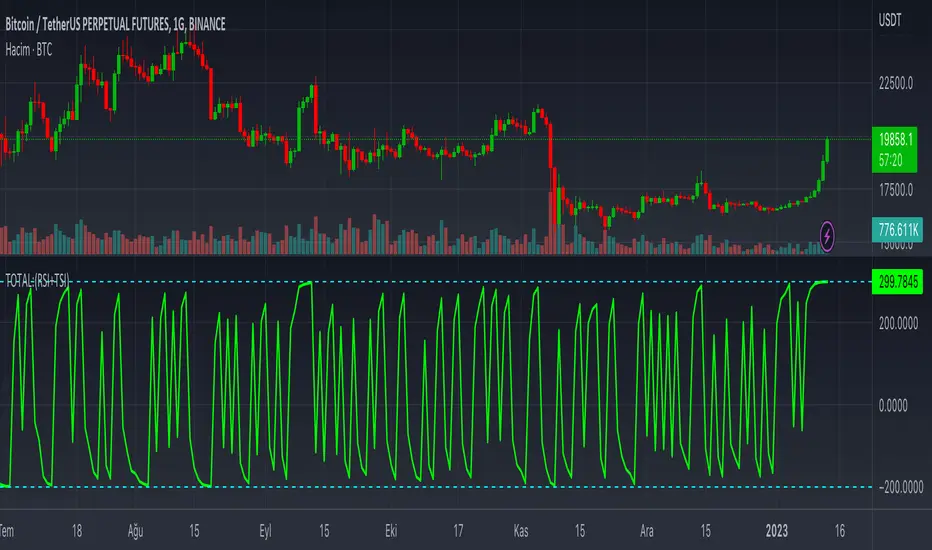
TOTAL:(RSI+TSI)
This indicator collects instant data of RSI and TSI oscillators. RSI moves between (0) and (100) values as a moving line, while TSI moves between (-100) and (+100) values as two moving lines.
The top value of the sum of these values is graphically;
It takes the total value (+300) from RSI (+100), TSI (+100) and (+100).
The lowest value of the sum of these values is graphically;
It takes the value (-200) from the RSI (0), (-100) and (-100) from the TSI.
In case this indicator approaches (+300) graphically; It can be seen that price candlesticks mostly move upwards. This may not always give accurate results. Past incompatibilities can affect this situation.
In case this indicator approaches (-200) graphically; It can be seen that price candlesticks mostly move downwards. This may not always give accurate results. Past incompatibilities can affect this situation.
The graphical movements and numerical values created by this indicator do not give precise results for price candles.
Mã nguồn mở
Theo đúng tinh thần TradingView, tác giả của tập lệnh này đã công bố nó dưới dạng mã nguồn mở, để các nhà giao dịch có thể xem xét và xác minh chức năng. Chúc mừng tác giả! Mặc dù bạn có thể sử dụng miễn phí, hãy nhớ rằng việc công bố lại mã phải tuân theo Nội quy.
Thông báo miễn trừ trách nhiệm
Thông tin và các ấn phẩm này không nhằm mục đích, và không cấu thành, lời khuyên hoặc khuyến nghị về tài chính, đầu tư, giao dịch hay các loại khác do TradingView cung cấp hoặc xác nhận. Đọc thêm tại Điều khoản Sử dụng.