OPEN-SOURCE SCRIPT
Currency Pair Index Indicator
Here's how it works step by step:
The indicator takes an input parameter called "length," which determines the number of bars to consider for the calculation. A higher length value will result in a smoother indicator, while a lower length value will make it more sensitive to recent price changes.
It then calculates the bullish sentiment by summing the volume multiplied by the price change (close - open) for each bar where the close price is greater than the open price. If the close price is not greater than the open price, the value for that bar is set to zero. The sum of these values is divided by the total volume for the selected bars.
Similarly, the bearish sentiment is calculated by summing the volume multiplied by the price change (open - close) for each bar where the close price is less than the open price. If the close price is not less than the open price, the value for that bar is set to zero. The sum of these values is divided by the total volume for the selected bars.
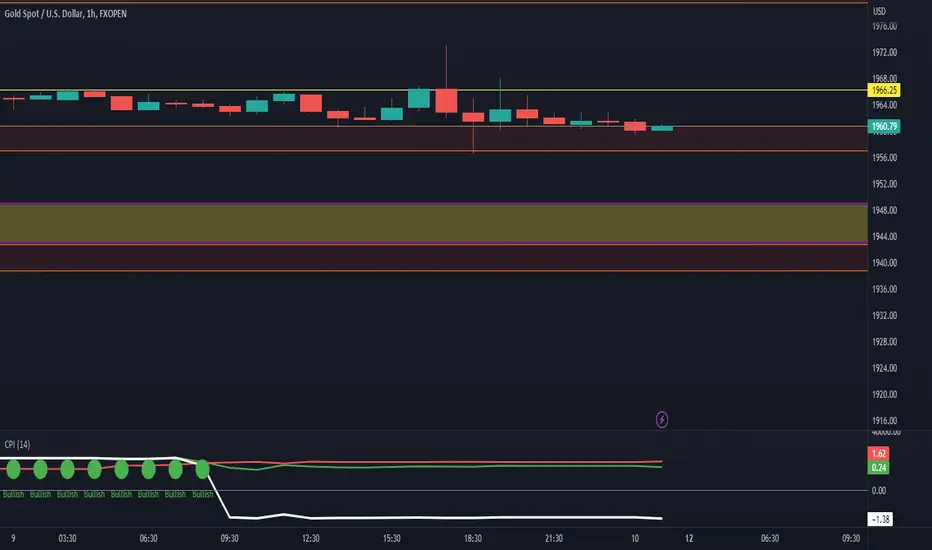
The bullish and bearish values are then plotted on the chart as separate line graphs. The bullish sentiment is represented by a green line, while the bearish sentiment is represented by a red line.
The difference between the bullish and bearish values is also plotted as a blue line. This line represents the overall sentiment of the currency pair index.
Additionally, arrow symbols are plotted below the price bars to indicate bullish or bearish signals. A green arrow is displayed when the bullish sentiment is higher than the bearish sentiment, indicating a bullish signal. A red arrow is displayed when the bearish sentiment is higher than the bullish sentiment, indicating a bearish signal.
By observing the indicator's line graphs and arrow symbols, traders can get an idea of the overall sentiment of the currency pair and identify potential bullish or bearish trading opportunities.
The indicator takes an input parameter called "length," which determines the number of bars to consider for the calculation. A higher length value will result in a smoother indicator, while a lower length value will make it more sensitive to recent price changes.
It then calculates the bullish sentiment by summing the volume multiplied by the price change (close - open) for each bar where the close price is greater than the open price. If the close price is not greater than the open price, the value for that bar is set to zero. The sum of these values is divided by the total volume for the selected bars.
Similarly, the bearish sentiment is calculated by summing the volume multiplied by the price change (open - close) for each bar where the close price is less than the open price. If the close price is not less than the open price, the value for that bar is set to zero. The sum of these values is divided by the total volume for the selected bars.
The bullish and bearish values are then plotted on the chart as separate line graphs. The bullish sentiment is represented by a green line, while the bearish sentiment is represented by a red line.
The difference between the bullish and bearish values is also plotted as a blue line. This line represents the overall sentiment of the currency pair index.
Additionally, arrow symbols are plotted below the price bars to indicate bullish or bearish signals. A green arrow is displayed when the bullish sentiment is higher than the bearish sentiment, indicating a bullish signal. A red arrow is displayed when the bearish sentiment is higher than the bullish sentiment, indicating a bearish signal.
By observing the indicator's line graphs and arrow symbols, traders can get an idea of the overall sentiment of the currency pair and identify potential bullish or bearish trading opportunities.
Mã nguồn mở
Theo đúng tinh thần TradingView, tác giả của tập lệnh này đã công bố nó dưới dạng mã nguồn mở, để các nhà giao dịch có thể xem xét và xác minh chức năng. Chúc mừng tác giả! Mặc dù bạn có thể sử dụng miễn phí, hãy nhớ rằng việc công bố lại mã phải tuân theo Nội quy.
Thông báo miễn trừ trách nhiệm
Thông tin và các ấn phẩm này không nhằm mục đích, và không cấu thành, lời khuyên hoặc khuyến nghị về tài chính, đầu tư, giao dịch hay các loại khác do TradingView cung cấp hoặc xác nhận. Đọc thêm tại Điều khoản Sử dụng.