OPEN-SOURCE SCRIPT
Streak-Based Trading Strategy
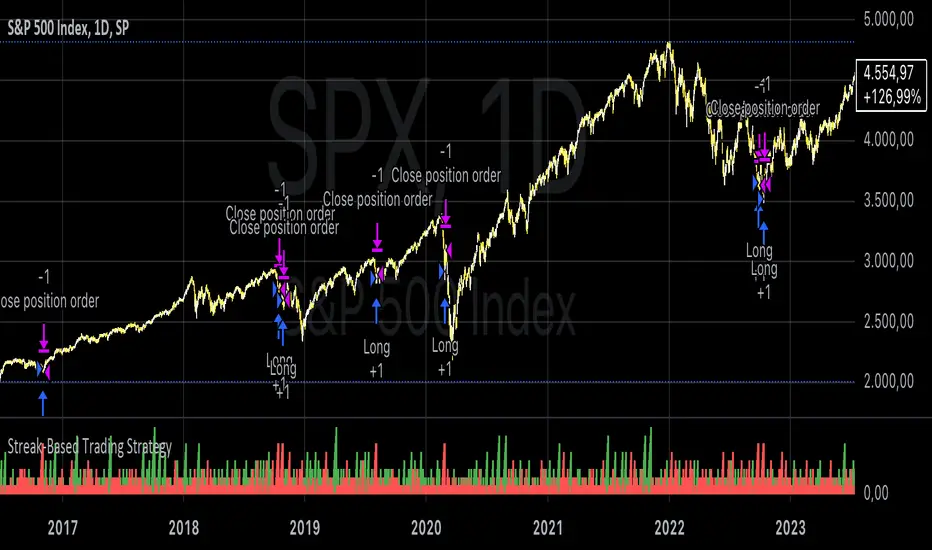
The strategy outlined in the provided script is a streak-based trading strategy that focuses on analyzing winning and losing streaks. It’s important to emphasize that this strategy is not intended for actual trading but rather for statistical analysis of streak series.
How the Strategy Works
1. Parameter Definition:
• Trade Direction: Users can choose between “Long” (buy) and “Short” (sell).
• Streak Threshold: Defines how many consecutive wins or losses are needed to trigger a trade.
• Hold Duration: Specifies how many periods the position will be held.
• Doji Threshold: Determines the sensitivity for Doji candles, which indicate market uncertainty.
2. Streak Calculation:
• The script identifies Doji candles and counts winning and losing streaks based on the closing price compared to the previous closing price.
• Streak counting occurs only when no position is currently held.
3. Trade Conditions:
• If the loss streak reaches the defined threshold and the trade direction is “Long,” a buy position is opened.
• If the win streak is met and the trade direction is “Short,” a sell position is opened.
• The position is held for the specified duration.
4. Visualization:
• Winning and losing streaks are plotted as histograms to facilitate analysis.
Scientific Basis
The concept of analyzing streaks in financial markets is well-documented in behavioral economics and finance. Studies have shown that markets often exhibit momentum and trend-following behavior, meaning the likelihood of consecutive winning or losing periods can be higher than what random statistics would suggest (see, for example, “The Behavior of Stock-Market Prices” by Eugene Fama).
Additionally, empirical research indicates that investors often make decisions based on psychological factors influenced by streaks. This can lead to irrational behavior, as they may focus on past wins or losses (see “Behavioral Finance: Psychology, Decision-Making, and Markets” by R. M. F. F. Thaler).
Overall, this strategy serves as a tool for statistical analysis of streak series, providing deeper insights into market behavior and trends rather than being directly used for trading decisions.
Mã nguồn mở
Theo đúng tinh thần TradingView, tác giả của tập lệnh này đã công bố nó dưới dạng mã nguồn mở, để các nhà giao dịch có thể xem xét và xác minh chức năng. Chúc mừng tác giả! Mặc dù bạn có thể sử dụng miễn phí, hãy nhớ rằng việc công bố lại mã phải tuân theo Nội quy.
Where others speculate, we systematize.
edgetools.org
edgetools.org
Thông báo miễn trừ trách nhiệm
Thông tin và các ấn phẩm này không nhằm mục đích, và không cấu thành, lời khuyên hoặc khuyến nghị về tài chính, đầu tư, giao dịch hay các loại khác do TradingView cung cấp hoặc xác nhận. Đọc thêm tại Điều khoản Sử dụng.