PINE LIBRARY
hinton_map
█ HINTON MAP
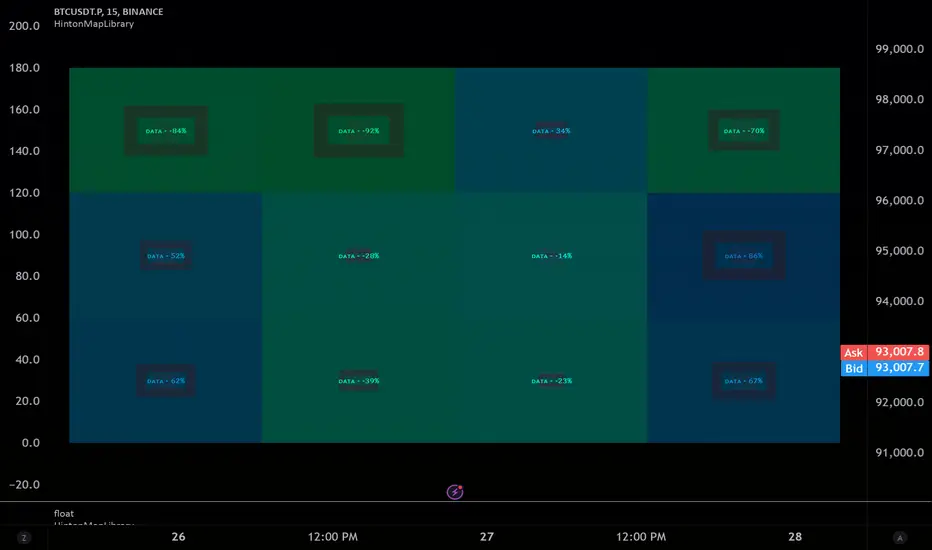
This library provides functions to create and display a Hinton Map visualization. A Hinton map uses squares to represent the magnitude and direction of values in a matrix. This library allows you to display multiple ticker/timeframe/indicator combinations on a single chart, using color/boxsize/bnordersize to represent the values used. The values must be from -1.0 to 1.0 in value. 3 different values can be input per square.
Example Usage:
The example below demonstrates how to create a Hinton Map for two symbols (AAPL and MSFT) across three timeframes (1 minute, 5 minutes, and 1 day).
Pine Script®
█ createHintonUnit
Creates a Hinton unit.
•fillValue
Value to determine the fill color hue.
Type: float
Default Value: 0.0
•borderValue
Value to determine the border color hue and width.
Type: float
Default Value: 0.0
•innerValue
Value to determine the inner box color hue.
Type: float
Default Value: 0.0
•boxText
Text to display in the inner box.
Type: dv.DisplayValue
Default Value: na
•tooltipText
Tooltip text for the inner box.
Type: dv.DisplayValue
Default Value: na
Returns: HintonUnit
█ initHintonData
Initializes Hinton map data structure.
•rows
Number of rows.
Type: int
•columns
Number of columns.
Type: int
Returns: HintonData
█ drawHintonMap
Draws a Hinton map.
•hintonData
Hinton map data.
Type: HintonData
•unitSize
Size of each unit in bars.
Type: int
Default Value: 10
•borderWidth
Base width of the inner box border.
Type: int
Default Value: 5
•plusHue
Hue value for positive values (0-360).
Type: float
Default Value: 180
•minusHue
Hue value for negative values (0-360).
Type: float
Default Value: -30
█ HintonUnit
Data for a Hinton unit.
•fillValue
Value to determine the fill color hue.
Type: float
•borderValue
Value to determine the border color hue and width.
Type: float
•innerValue
Value to determine the inner box color hue.
Type: float
•boxText
Text to display in the inner box.
Type: dv.DisplayValue
•tooltipText
Tooltip text for the inner box.
Type: dv.DisplayValue
█ HintonData
Structure to store Hinton map data.
•unitMatrix
Matrix of Hinton units.
Type: matrix<HintonUnit>
•lineMatrix
Matrix of lines.
Type: matrix<line>
•labelMatrix
Matrix of labels.
Type: matrix<label>
•boxMatrix
Matrix of boxes.
Type: matrix<box>
•fillMatrix
Matrix of line fills.
Type: matrix<linefill>
This library provides functions to create and display a Hinton Map visualization. A Hinton map uses squares to represent the magnitude and direction of values in a matrix. This library allows you to display multiple ticker/timeframe/indicator combinations on a single chart, using color/boxsize/bnordersize to represent the values used. The values must be from -1.0 to 1.0 in value. 3 different values can be input per square.
Example Usage:
The example below demonstrates how to create a Hinton Map for two symbols (AAPL and MSFT) across three timeframes (1 minute, 5 minutes, and 1 day).
var hintonData = hinton_map.initHintonData(2, 3)
tickers = array.from("AAPL", "MSFT")
timeframes = array.from("1", "5", "1D")
for i = 0 to array.size(tickers) - 1
for j = 0 to array.size(timeframes) - 1
ticker = array.get(tickers, i)
timeframe = array.get(timeframes, j)
[close_current, close_previous, rsi_current] = request.security(ticker, timeframe, [close, close[1], ta.rsi(close, 14)], lookahead = barmerge.lookahead_on)
percent_change = (close_current - close_previous) / close_previous * 100
rsi_deviation = rsi_current - 50
hintonData.unitMatrix.set(i, j, hinton_map.createHintonUnit(
fillValue = percent_change,
borderValue = rsi_deviation,
innerValue = percent_change * rsi_deviation,
boxText = dv.from_string(str.tostring(math.round(percent_change, 2)) + "%"),
tooltipText = dv.from_string(syminfo.ticker + ", " + timeframe + ": " + str.tostring(math.round(percent_change, 2)) + "%, RSI: " + str.tostring(math.round(rsi_current, 2)))
))
hinton_map.drawHintonMap(hintonData)
█ createHintonUnit
Creates a Hinton unit.
•fillValue
Value to determine the fill color hue.
Type: float
Default Value: 0.0
•borderValue
Value to determine the border color hue and width.
Type: float
Default Value: 0.0
•innerValue
Value to determine the inner box color hue.
Type: float
Default Value: 0.0
•boxText
Text to display in the inner box.
Type: dv.DisplayValue
Default Value: na
•tooltipText
Tooltip text for the inner box.
Type: dv.DisplayValue
Default Value: na
Returns: HintonUnit
█ initHintonData
Initializes Hinton map data structure.
•rows
Number of rows.
Type: int
•columns
Number of columns.
Type: int
Returns: HintonData
█ drawHintonMap
Draws a Hinton map.
•hintonData
Hinton map data.
Type: HintonData
•unitSize
Size of each unit in bars.
Type: int
Default Value: 10
•borderWidth
Base width of the inner box border.
Type: int
Default Value: 5
•plusHue
Hue value for positive values (0-360).
Type: float
Default Value: 180
•minusHue
Hue value for negative values (0-360).
Type: float
Default Value: -30
█ HintonUnit
Data for a Hinton unit.
•fillValue
Value to determine the fill color hue.
Type: float
•borderValue
Value to determine the border color hue and width.
Type: float
•innerValue
Value to determine the inner box color hue.
Type: float
•boxText
Text to display in the inner box.
Type: dv.DisplayValue
•tooltipText
Tooltip text for the inner box.
Type: dv.DisplayValue
█ HintonData
Structure to store Hinton map data.
•unitMatrix
Matrix of Hinton units.
Type: matrix<HintonUnit>
•lineMatrix
Matrix of lines.
Type: matrix<line>
•labelMatrix
Matrix of labels.
Type: matrix<label>
•boxMatrix
Matrix of boxes.
Type: matrix<box>
•fillMatrix
Matrix of line fills.
Type: matrix<linefill>
Thư viện Pine
Theo đúng tinh thần TradingView, tác giả đã công bố mã Pine này như một thư viện mã nguồn mở để các lập trình viên Pine khác trong cộng đồng có thể tái sử dụng. Chúc mừng tác giả! Bạn có thể sử dụng thư viện này cho mục đích cá nhân hoặc trong các ấn phẩm mã nguồn mở khác, nhưng việc tái sử dụng mã này trong các ấn phẩm phải tuân theo Nội Quy.
Thông báo miễn trừ trách nhiệm
Thông tin và các ấn phẩm này không nhằm mục đích, và không cấu thành, lời khuyên hoặc khuyến nghị về tài chính, đầu tư, giao dịch hay các loại khác do TradingView cung cấp hoặc xác nhận. Đọc thêm tại Điều khoản Sử dụng.