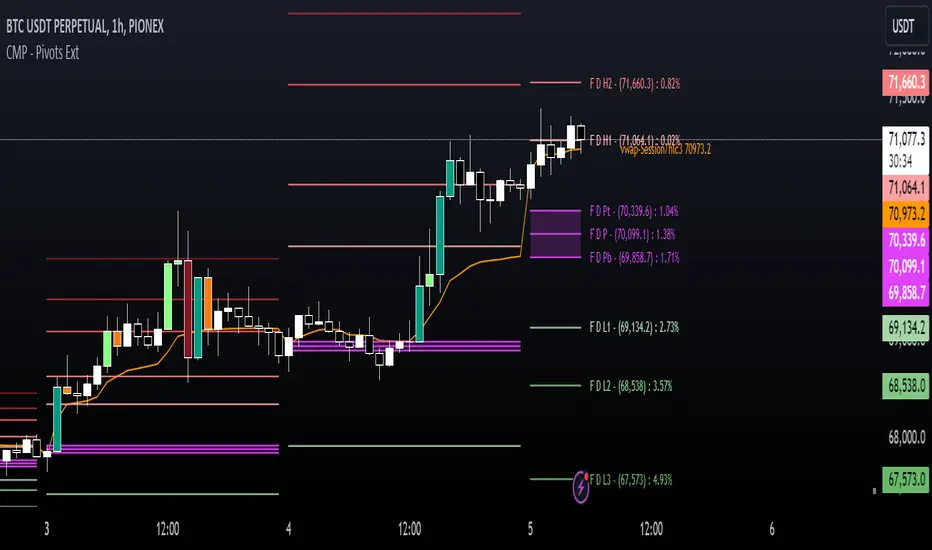
CMP - Pivots Extreme

(Original Publisher of this indicator is rebranding and moving under the CMP organization)
An expanded pivot points indicator that allows you to select 3 different pivots to display at the same time including an option to look at the next pivot of your selection. It also includes 3 configurable VWAP plots and an option to change bar color based on volume.
Inputs Tab:
Level ID - Allows you to have the labels show H/L (High/Low) or S/R (Support/Resistance) whichever you prefer.
Pivot 1, 2 and 3 selections are all the same but Pivot 1 is the only one that is 'plotted' and available to assign alerts to.
For Pivot 1, the 'Show Calc Table' gives you R/R or Gain % data for price moving from one pivot level to another, along with an option to set your pivot based SL level to adjust calculations.
Type: Type of pivot you want to show: Camarilla, Traditional, etc
Resolution: 1 Hour, 2 Hour, 4 hour, 6 hour, 12 hour, Daily, 2 Day, 3 Day, Weekly, Monthly, Yearly
History: Number of historical pivots you want to see on the chart (0 shows only current/live pivot)
Note: TradingView has a limit (500) to the number of lines and labels plotted by indicators. If you hit the max, the older lines from pivots will be removed to stay within the limit. Also note that especially with higher TF pivot points (weekly, monthly) there may not be as many that can be calculated so less may show than you have set for history. This is not a bug but a limitation on the data available to calculate pivots and data processing limitations.
Line: Different format options, width selection and option to 'Extend Line'. If 'Extend Line' is selected, the pivot lines will extend to the end of the current day (similar to Pivot Points Standard), if not selected they will end at the last bar on the chart.
Lots of different label text options to choose from, have labels either show at the left or right of the level line and you can change the label size.
Individual selections for showing levels and what color you want them to be.
P - Pivot on/off along with color selection
CPR - Shows Pt (CPR Pivot Top) and Pb (CPR Pivot Bottom)
Fill CPR Box - fills the CPR to highlight the range on the chart
Individual selections to turn on/off L1-L6 and H1-H6 levels along with individual color selections for each
NOTE: Not all pivot types have 6 levels. If you select a pivot type that has less than 6 (example Fibonacci has 4) only 4 will show and levels 5 & 6 are ignored by the script (you don't have to turn them off).
"Next Pivot" is the future resolution pivot, with similar selections to Pivots 1-3. The main difference is that the levels to show are grouped H/L 1, H/L 2, etc.
VWAP
Show VWAP Labels - turns labels on/off
Label - different text selections for the label
Size - selections for different VWAP label sizes
3 different VWAP configurations that you can turn on, each with selectable line/label color and label text color. They default to daily, weekly and monthly. You can individually select the period, source and offset for each.
Change Bar Color: Changes bar color based on volume standard deviations.
# Bars For Average Vol - Identifies how many bars back you want to be used in the average calculations.
Extreme (Color 0) - Identifies the number of deviations from average volume for the 'extreme' bar color setting.
High (Color 1) - Identifies the number of deviations from average volume for the 'high' bar color setting.
Moderate (Color 2) - Identifies the number of deviations from average volume for the 'moderate' bar color setting.
Extreme Low (Color 3) - Identifies the number of deviations from average to highlight very low volume.
Bar color settings can be changed on the 'Style' tab. There are 2 sets of colors from 0-3, one set for Bullish (bar close > open) and one set for Bearish (bar close < open).
The last add is the 'Diff TF Candle' option. This will allow you to see a higher TF ghost candle (default is 15 minute) on a chart that has a lower TF. This can be helpful if you are using 2 different timeframes to identify entry points.
Tập lệnh chỉ hiển thị cho người được mời
Quyền truy cập vào tập lệnh này bị hạn chế đối với người dùng được tác giả ủy quyền và thường yêu cầu thanh toán. Bạn có thể thêm nó vào mục yêu thích của mình, nhưng bạn sẽ chỉ có thể sử dụng nó sau khi yêu cầu sự cho phép từ tác giả. Liên hệ CartoonMoneyPrinters để thêm thông tin, hoặc làm theo hướng dẫn của tác giả bên dưới.
Xin lưu ý rằng đây là tập lệnh riêng tư, chỉ dành cho người được mời và người kiểm duyệt tập lệnh không phân tích. Chưa xác định có tuân thủ với Quy tắc nội bộ không. TradingView gợi ý bạn không trả tiền để sử dụng tập lệnh trừ khi bạn tin tưởng 100% vào tác giả của tập lệnh và hiểu cách hoạt động của tập lệnh. Trong nhiều trường hợp, bạn có thể tìm thấy giải pháp thay thế nguồn mở tốt miễn phí trong Tập lệnh cộng đồng của chúng tôi.