OPEN-SOURCE SCRIPT
Balance Zone Extension

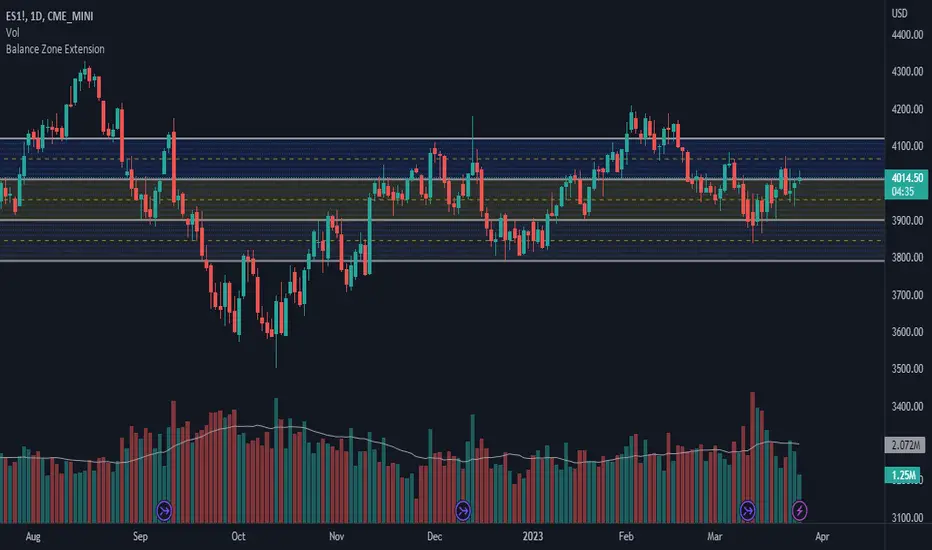
Balance zones are an aspect of trading that many traders notice. Balance Zones are formed when a market is in equilibrium and respects a certain high and low multiple times. These zones could also be called accumulation or distribution areas depending on the price action. If the term "choppy" is used to describe a given markets price action, it is probably a fair statement to say that the market is currently in a Balance Zone.
This script is a take on vwaptrader1's teachings where you take a balance zone and "double it" to get a target if/when it does break out of balance. It provides an automated way of extending levels based on a given balance range.
The lines plotted by the script are calculated based off of the balance high/low inputs, how many sections are desired per zone, and how many boxes to plot based on the other user inputs.
Warning: Due to a current limitation of the Pine, this script is only allowed to plot up to 500 lines total. If you start to notice lines starting to disappear or you begin getting a script error, double check the input settings as the script may have crossed the 500 line threshold.
This can be used in conjunction with Fixed Range Volume Profile . Select the balance range with the Fixed Volume Profile . Note the Value Area High and Value Area Low prices and input those into the balance range High/Low inputs.
Use to create price targets from Balance Zone Breakouts
A recent example of this idea in action on ticker ES1! 2 hour chart where the balance range was found and the target (double the box size of the balance range) was hit.

Another example of this same concept but on a normal security like AAPL but on a 30 minute chart:

Extending the usefulness even further to crypto on BTCUSD with a 5 minute chart:

Use to create reference levels for future price action
The other way to utilize this is to provide future reference levels from a key balance range from the past.
Here is another example utilizing the AMD daily chart . First, a balance zone was noted for all of 2017:

Moving forward to the most recent price action in 2023, notice that the box extension levels are still fairly well respected almost 6 years later!

This script is a take on vwaptrader1's teachings where you take a balance zone and "double it" to get a target if/when it does break out of balance. It provides an automated way of extending levels based on a given balance range.
The lines plotted by the script are calculated based off of the balance high/low inputs, how many sections are desired per zone, and how many boxes to plot based on the other user inputs.
Warning: Due to a current limitation of the Pine, this script is only allowed to plot up to 500 lines total. If you start to notice lines starting to disappear or you begin getting a script error, double check the input settings as the script may have crossed the 500 line threshold.
This can be used in conjunction with Fixed Range Volume Profile . Select the balance range with the Fixed Volume Profile . Note the Value Area High and Value Area Low prices and input those into the balance range High/Low inputs.
Use to create price targets from Balance Zone Breakouts
A recent example of this idea in action on ticker ES1! 2 hour chart where the balance range was found and the target (double the box size of the balance range) was hit.
Another example of this same concept but on a normal security like AAPL but on a 30 minute chart:
Extending the usefulness even further to crypto on BTCUSD with a 5 minute chart:
Use to create reference levels for future price action
The other way to utilize this is to provide future reference levels from a key balance range from the past.
Here is another example utilizing the AMD daily chart . First, a balance zone was noted for all of 2017:
Moving forward to the most recent price action in 2023, notice that the box extension levels are still fairly well respected almost 6 years later!
Mã nguồn mở
Theo đúng tinh thần TradingView, tác giả của tập lệnh này đã công bố nó dưới dạng mã nguồn mở, để các nhà giao dịch có thể xem xét và xác minh chức năng. Chúc mừng tác giả! Mặc dù bạn có thể sử dụng miễn phí, hãy nhớ rằng việc công bố lại mã phải tuân theo Nội quy.
Thông báo miễn trừ trách nhiệm
Thông tin và các ấn phẩm này không nhằm mục đích, và không cấu thành, lời khuyên hoặc khuyến nghị về tài chính, đầu tư, giao dịch hay các loại khác do TradingView cung cấp hoặc xác nhận. Đọc thêm tại Điều khoản Sử dụng.