OPEN-SOURCE SCRIPT
Adjustable Percentage Range Moving Average
Adjustable Percentage Range Moving Average (APRMA)
The Adjustable Percentage Range Moving Average (APRMA) is a technical analysis tool designed for traders and market analysts who seek a dynamic approach to understanding market volatility and trend identification. Unlike traditional moving averages, the APRMA incorporates user-adjustable percentage bands around a central moving average line, offering a customizable view of price action relative to its recent history.
Key Features:
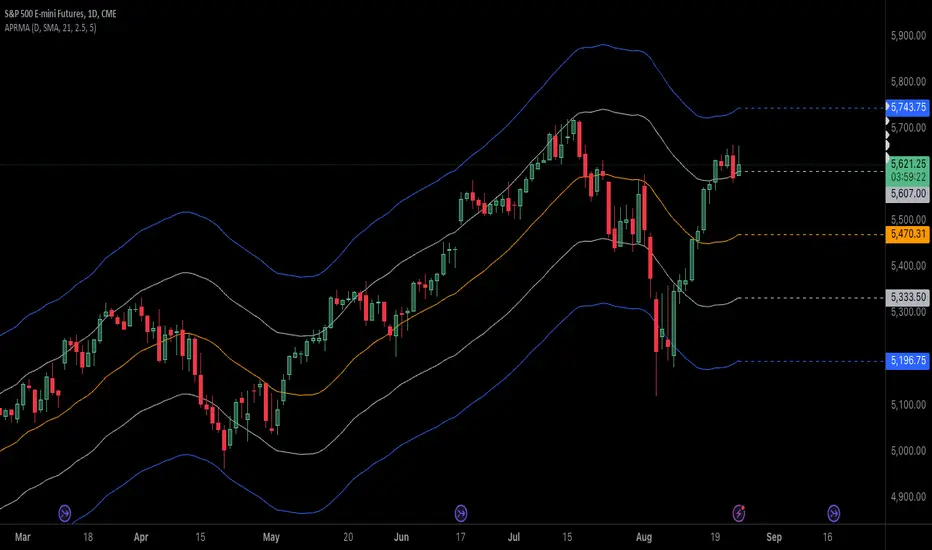
Central Moving Average: At its core, APRMA calculates a moving average (type of your choice) of the price over a specified number of periods, serving as the baseline for the indicator.
Percentage Bands: Surrounding the moving average are four bands, two above and two below, set at user-defined percentages away from the central line. These bands expand and contract based on the percentage input, not on standard deviation like Bollinger Bands, which allows for a consistent visual interpretation of how far the price has moved from its average.
Customizability: Users can adjust:
The length of the moving average period to suit short-term, medium-term, or long-term analysis.
The percentage offset for the bands, enabling traders to set the sensitivity of the indicator according to the asset's volatility or their trading strategy.
Visual Interpretation:
When the price moves towards or beyond the upper band, it might indicate that the asset is potentially overbought or that a strong upward trend is in place.
Conversely, price action near or below the lower band could suggest an oversold condition or a strong downward trend.
The space between the bands can be used to gauge volatility; narrower bands suggest lower current volatility relative to the average, while wider bands indicate higher volatility.
Usage in Trading:
Trend Confirmation: A price staying above the moving average and pushing the upper band might confirm an uptrend, while staying below and testing the lower band could confirm a downtrend.
Reversion Strategies: Traders might look for price to revert to the mean (moving average) when it touches or crosses the bands, setting up potential entry or exit points.
Breakout Signals: A price moving decisively through a band after a period of consolidation within the bands might signal a breakout.
The APRMA provides a clear, adaptable framework for traders to visualize where the price stands in relation to its recent average, offering insights into potential overbought/oversold conditions, trend strength, and volatility, all tailored by the trader's strategic preferences.
The Adjustable Percentage Range Moving Average (APRMA) is a technical analysis tool designed for traders and market analysts who seek a dynamic approach to understanding market volatility and trend identification. Unlike traditional moving averages, the APRMA incorporates user-adjustable percentage bands around a central moving average line, offering a customizable view of price action relative to its recent history.
Key Features:
Central Moving Average: At its core, APRMA calculates a moving average (type of your choice) of the price over a specified number of periods, serving as the baseline for the indicator.
Percentage Bands: Surrounding the moving average are four bands, two above and two below, set at user-defined percentages away from the central line. These bands expand and contract based on the percentage input, not on standard deviation like Bollinger Bands, which allows for a consistent visual interpretation of how far the price has moved from its average.
Customizability: Users can adjust:
The length of the moving average period to suit short-term, medium-term, or long-term analysis.
The percentage offset for the bands, enabling traders to set the sensitivity of the indicator according to the asset's volatility or their trading strategy.
Visual Interpretation:
When the price moves towards or beyond the upper band, it might indicate that the asset is potentially overbought or that a strong upward trend is in place.
Conversely, price action near or below the lower band could suggest an oversold condition or a strong downward trend.
The space between the bands can be used to gauge volatility; narrower bands suggest lower current volatility relative to the average, while wider bands indicate higher volatility.
Usage in Trading:
Trend Confirmation: A price staying above the moving average and pushing the upper band might confirm an uptrend, while staying below and testing the lower band could confirm a downtrend.
Reversion Strategies: Traders might look for price to revert to the mean (moving average) when it touches or crosses the bands, setting up potential entry or exit points.
Breakout Signals: A price moving decisively through a band after a period of consolidation within the bands might signal a breakout.
The APRMA provides a clear, adaptable framework for traders to visualize where the price stands in relation to its recent average, offering insights into potential overbought/oversold conditions, trend strength, and volatility, all tailored by the trader's strategic preferences.
Mã nguồn mở
Theo đúng tinh thần TradingView, tác giả của tập lệnh này đã công bố nó dưới dạng mã nguồn mở, để các nhà giao dịch có thể xem xét và xác minh chức năng. Chúc mừng tác giả! Mặc dù bạn có thể sử dụng miễn phí, hãy nhớ rằng việc công bố lại mã phải tuân theo Nội quy.
Thông báo miễn trừ trách nhiệm
Thông tin và các ấn phẩm này không nhằm mục đích, và không cấu thành, lời khuyên hoặc khuyến nghị về tài chính, đầu tư, giao dịch hay các loại khác do TradingView cung cấp hoặc xác nhận. Đọc thêm tại Điều khoản Sử dụng.