OPEN-SOURCE SCRIPT
Analyst Table (Zeiierman)
█ Overview
The Analyst Table (Zeiierman) provides a comprehensive visual representation of analyst estimates and recommendations for any stock. This indicator displays crucial analyst data, including the highest, average, and lowest price targets, directly on the price chart. Additionally, it features a well-organized table summarizing various types of analyst recommendations, offering traders valuable insights into market sentiment and expectations. This tool is ideal for traders seeking a quick overview of analyst opinions and recommendations on specific stocks.

█ How It Works
The indicator works by retrieving analyst data such as price targets and recommendations from the TradingView data feed. It visually represents these estimates on the chart and creates a structured table for easy reference, consolidating all the information in an organized format.
Key Components:
█ How to Use
Traders can use this indicator to gain insights into the expectations of financial analysts regarding the future performance of an asset. By observing the highest, lowest, and average price targets, traders can assess the range of possible future prices as predicted by analysts. The recommendation table helps in understanding the general sentiment among analysts, whether it's bullish, bearish, or neutral.
Visual Analysis: Use the visual indicators to quickly gauge where the current price stands relative to analyst targets.

Sentiment Assessment: Refer to the table to understand the distribution of buy, hold, and sell recommendations.

█ Settings
The indicator settings allow users to enable or disable different target lines, select colors for the lines and table cells, and choose the position and size of the analyst table on the chart.
-----------------
Disclaimer
The information contained in my Scripts/Indicators/Ideas/Algos/Systems does not constitute financial advice or a solicitation to buy or sell any securities of any type. I will not accept liability for any loss or damage, including without limitation any loss of profit, which may arise directly or indirectly from the use of or reliance on such information.
All investments involve risk, and the past performance of a security, industry, sector, market, financial product, trading strategy, backtest, or individual's trading does not guarantee future results or returns. Investors are fully responsible for any investment decisions they make. Such decisions should be based solely on an evaluation of their financial circumstances, investment objectives, risk tolerance, and liquidity needs.
My Scripts/Indicators/Ideas/Algos/Systems are only for educational purposes!
The Analyst Table (Zeiierman) provides a comprehensive visual representation of analyst estimates and recommendations for any stock. This indicator displays crucial analyst data, including the highest, average, and lowest price targets, directly on the price chart. Additionally, it features a well-organized table summarizing various types of analyst recommendations, offering traders valuable insights into market sentiment and expectations. This tool is ideal for traders seeking a quick overview of analyst opinions and recommendations on specific stocks.
█ How It Works
The indicator works by retrieving analyst data such as price targets and recommendations from the TradingView data feed. It visually represents these estimates on the chart and creates a structured table for easy reference, consolidating all the information in an organized format.
Key Components:
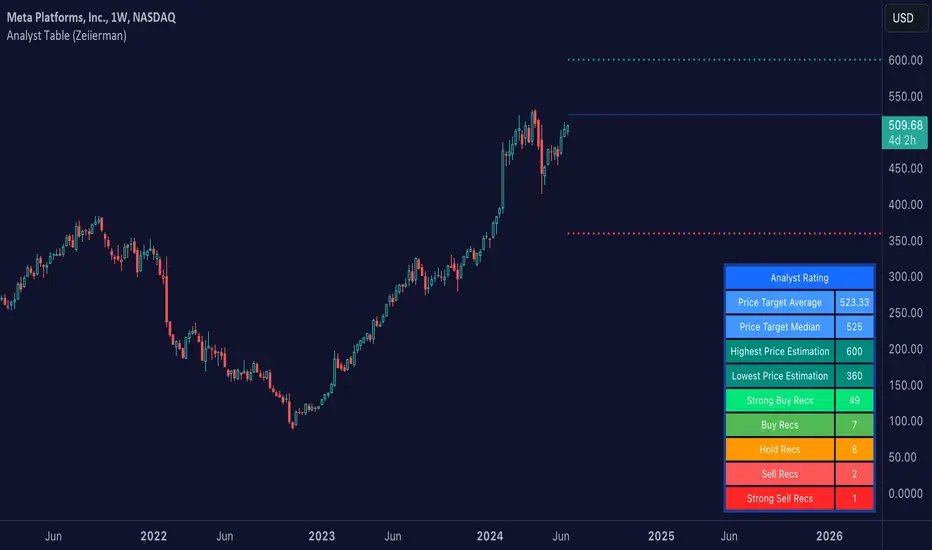
- High Estimate Line: A dotted line representing the highest price target.
- Low Estimate Line: A dotted line representing the lowest price target.
- Target Estimate Box: A box representing the range between the average and median price targets.
- Analyst Table: A table displaying detailed information about various analyst recommendations and price targets.
█ How to Use
Traders can use this indicator to gain insights into the expectations of financial analysts regarding the future performance of an asset. By observing the highest, lowest, and average price targets, traders can assess the range of possible future prices as predicted by analysts. The recommendation table helps in understanding the general sentiment among analysts, whether it's bullish, bearish, or neutral.
Visual Analysis: Use the visual indicators to quickly gauge where the current price stands relative to analyst targets.
Sentiment Assessment: Refer to the table to understand the distribution of buy, hold, and sell recommendations.
█ Settings
The indicator settings allow users to enable or disable different target lines, select colors for the lines and table cells, and choose the position and size of the analyst table on the chart.
-----------------
Disclaimer
The information contained in my Scripts/Indicators/Ideas/Algos/Systems does not constitute financial advice or a solicitation to buy or sell any securities of any type. I will not accept liability for any loss or damage, including without limitation any loss of profit, which may arise directly or indirectly from the use of or reliance on such information.
All investments involve risk, and the past performance of a security, industry, sector, market, financial product, trading strategy, backtest, or individual's trading does not guarantee future results or returns. Investors are fully responsible for any investment decisions they make. Such decisions should be based solely on an evaluation of their financial circumstances, investment objectives, risk tolerance, and liquidity needs.
My Scripts/Indicators/Ideas/Algos/Systems are only for educational purposes!
Mã nguồn mở
Theo đúng tinh thần TradingView, tác giả của tập lệnh này đã công bố nó dưới dạng mã nguồn mở, để các nhà giao dịch có thể xem xét và xác minh chức năng. Chúc mừng tác giả! Mặc dù bạn có thể sử dụng miễn phí, hãy nhớ rằng việc công bố lại mã phải tuân theo Nội quy.
Access my indicators at: zeiierman.com
Join Our Free Discord: discord.gg/zeiiermantrading
Join Our Free Discord: discord.gg/zeiiermantrading
Thông báo miễn trừ trách nhiệm
Thông tin và các ấn phẩm này không nhằm mục đích, và không cấu thành, lời khuyên hoặc khuyến nghị về tài chính, đầu tư, giao dịch hay các loại khác do TradingView cung cấp hoặc xác nhận. Đọc thêm tại Điều khoản Sử dụng.