OPEN-SOURCE SCRIPT
Currency Volatility Index (CVI)
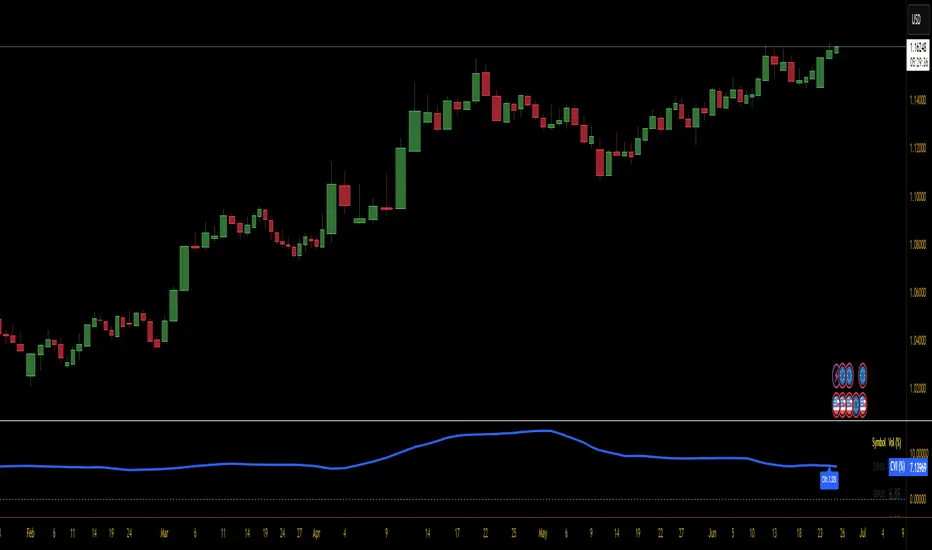
This Currency Volatility Index (CVI) indicator aggregates the realized volatility of the eight “major” FX pairs into a single, tradable series—much like an FX-version of the VIX. Here’s what it does step by step:
Inputs & Settings
• Volatility Length (default 20 days): the lookback over which daily log-returns’ standard deviation is computed.
• Data Timeframe (default Daily): the resolution at which price data is fetched for each pair.
• Smoothing Length (default 5): the period of a simple moving average applied to the raw, averaged volatility (in %).
Pair-by-Pair Volatility Calculation
For each hard-coded symbol (EURUSD, GBPUSD, USDJPY, USDCHF, AUDUSD, USDCAD, NZDUSD, EURGBP):
Aggregation
The eight annualized volatilities are averaged (equal weights).
The resulting number is then multiplied by 100 to express it as a percentage.
Smoothing & Plotting
A simple moving average over the aggregated volatility smooths out spikes.
The smoothed CVI (%) is plotted as a standalone line below price charts.
Visualization Aids
A small table in the top-right corner shows each pair’s current volatility in percent.
A dynamic label on the final bar prints the latest CVI value directly on the chart.
Why use it?
Gives a one-stop measure of overall FX market turbulence.
Helps you compare “quiet” vs. “volatile” regimes across currencies.
Inputs & Settings
• Volatility Length (default 20 days): the lookback over which daily log-returns’ standard deviation is computed.
• Data Timeframe (default Daily): the resolution at which price data is fetched for each pair.
• Smoothing Length (default 5): the period of a simple moving average applied to the raw, averaged volatility (in %).
Pair-by-Pair Volatility Calculation
For each hard-coded symbol (EURUSD, GBPUSD, USDJPY, USDCHF, AUDUSD, USDCAD, NZDUSD, EURGBP):
- Pull the series of daily closes.
- Compute the series of log-returns: ln(today’s close / yesterday’s close).
- Calculate the standard deviation of those log-returns over your lookback.
- Annualize it (×√252) to convert daily volatility into an annualized figure.
Aggregation
The eight annualized volatilities are averaged (equal weights).
The resulting number is then multiplied by 100 to express it as a percentage.
Smoothing & Plotting
A simple moving average over the aggregated volatility smooths out spikes.
The smoothed CVI (%) is plotted as a standalone line below price charts.
Visualization Aids
A small table in the top-right corner shows each pair’s current volatility in percent.
A dynamic label on the final bar prints the latest CVI value directly on the chart.
Why use it?
Gives a one-stop measure of overall FX market turbulence.
Helps you compare “quiet” vs. “volatile” regimes across currencies.
Mã nguồn mở
Theo đúng tinh thần TradingView, tác giả của tập lệnh này đã công bố nó dưới dạng mã nguồn mở, để các nhà giao dịch có thể xem xét và xác minh chức năng. Chúc mừng tác giả! Mặc dù bạn có thể sử dụng miễn phí, hãy nhớ rằng việc công bố lại mã phải tuân theo Nội quy.
Thông báo miễn trừ trách nhiệm
Thông tin và các ấn phẩm này không nhằm mục đích, và không cấu thành, lời khuyên hoặc khuyến nghị về tài chính, đầu tư, giao dịch hay các loại khác do TradingView cung cấp hoặc xác nhận. Đọc thêm tại Điều khoản Sử dụng.