OPEN-SOURCE SCRIPT
Cập nhật Ultra Money Flow
Introduction
The Ultra Money Flow script is a technical indicator for analyzing stock trends. It highlights buying and selling power, helping you identify bullish (rising) or bearish (falling) market trends.
Detailed Description
The Ultra Money Flow script calculates and visually displays two main components: Fast and Slow money flow. These components represent short-term and long-term trends, respectively.
Here's how it works:
.........
.........
By using this indicator, traders can easily spot shifts in buying and selling power, allowing for better-informed decisions in the market.
Special Thanks
I use the TWMA-Function created from RedKTrader to smooth the values.
Special thanks to him for creating and sharing this function!
The Ultra Money Flow script is a technical indicator for analyzing stock trends. It highlights buying and selling power, helping you identify bullish (rising) or bearish (falling) market trends.
Detailed Description
The Ultra Money Flow script calculates and visually displays two main components: Fast and Slow money flow. These components represent short-term and long-term trends, respectively.
Here's how it works:
.........
- Inputs
You can adjust the speed of analysis (Fast Length and Slow Length) and the type of smoothing applied (e.g., Simple Moving Average, Exponential Moving Average).
Choose colors for visualizing the trends, with blue for bullish (positive) and orange for bearish (negative) movements.
..... - Money Flow Calculation
The script analyzes price changes (delta) over specified periods.
It separates upward price movements (buying power) from downward ones (selling power).
It then calculates the difference between these powers for both Fast and Slow components.
The types of smoothing methods range from traditional ones like the Simple Moving Average (SMA) to advanced ones like the Double Expotential Moving Average (DEMA) or the Triple Exponential Moving Average (TEMA) or the Recursive Moving Average (RMA) or the Weigthend Moving Average (WMA) or the Volume Weigthend Moving Average (VWMA) or Hull Moving Average (HMA).
Very Special ones are the Triple Weigthend Moving Average (TWMA) wich created RedKTrader.
I created the Multi Weigthend Moving Average (MWMA) wich is a simple signal line to the TWMA.
..... - Divergence
This indicator can show divergence by comparing the direction of price movements with the indicator value.
If the price and the indicator move in opposite directions, you can use these signals to help decide when to buy or sell.
..... - Auto Scaling
The script adjusts its calculations based on the time frame you are viewing, whether it's minutes, hours, or days, ensuring accurate representation across different time scales.
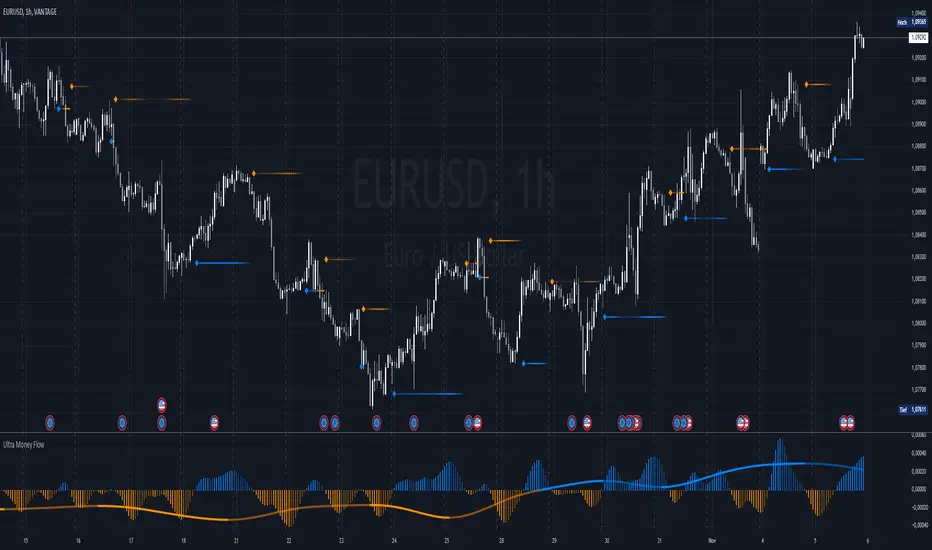
..... - Plotting
The script plots the Fast component as a histogram and the Slow component as a line, using the chosen colors to indicate bullish or bearish trends.
The thickness and transparency of these plots give additional clues about the strength of the trend.
.........
By using this indicator, traders can easily spot shifts in buying and selling power, allowing for better-informed decisions in the market.
Special Thanks
I use the TWMA-Function created from RedKTrader to smooth the values.
Special thanks to him for creating and sharing this function!
Phát hành các Ghi chú
update (added S/R levels at trend direction change)Phát hành các Ghi chú
bugfixMã nguồn mở
Theo đúng tinh thần TradingView, tác giả của tập lệnh này đã công bố nó dưới dạng mã nguồn mở, để các nhà giao dịch có thể xem xét và xác minh chức năng. Chúc mừng tác giả! Mặc dù bạn có thể sử dụng miễn phí, hãy nhớ rằng việc công bố lại mã phải tuân theo Nội quy.
Thông báo miễn trừ trách nhiệm
Thông tin và các ấn phẩm này không nhằm mục đích, và không cấu thành, lời khuyên hoặc khuyến nghị về tài chính, đầu tư, giao dịch hay các loại khác do TradingView cung cấp hoặc xác nhận. Đọc thêm tại Điều khoản Sử dụng.
Mã nguồn mở
Theo đúng tinh thần TradingView, tác giả của tập lệnh này đã công bố nó dưới dạng mã nguồn mở, để các nhà giao dịch có thể xem xét và xác minh chức năng. Chúc mừng tác giả! Mặc dù bạn có thể sử dụng miễn phí, hãy nhớ rằng việc công bố lại mã phải tuân theo Nội quy.
Thông báo miễn trừ trách nhiệm
Thông tin và các ấn phẩm này không nhằm mục đích, và không cấu thành, lời khuyên hoặc khuyến nghị về tài chính, đầu tư, giao dịch hay các loại khác do TradingView cung cấp hoặc xác nhận. Đọc thêm tại Điều khoản Sử dụng.