OPEN-SOURCE SCRIPT
Cập nhật Percentile Rank of Moving Average Convergence Divergence
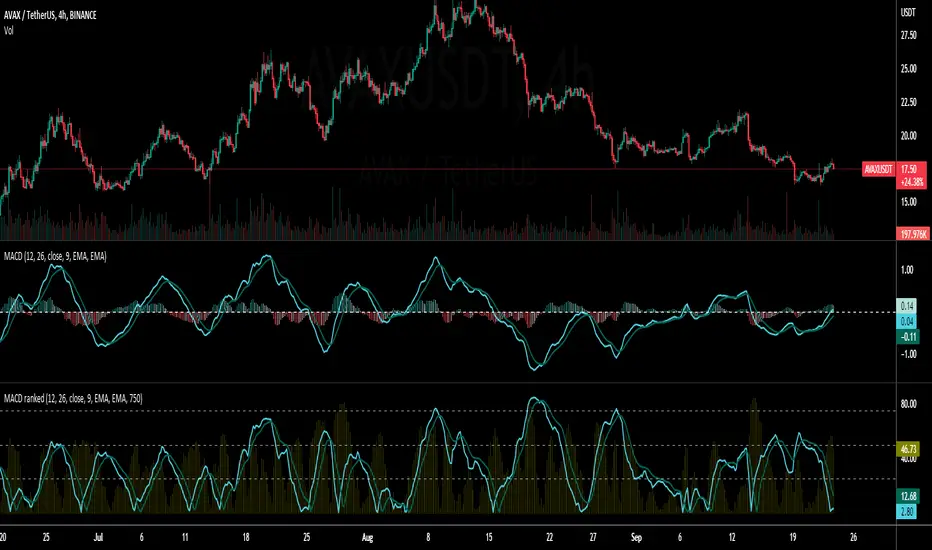
This simple indicator provides you three useful information of the Moving Average Convergence Divergence (MACD) indicator:
This indicator can be useful to identify the strength of trend. This indicator makes the assumption that market tends to revert into the opposite direction. If the market has been trending a lot, it should consolidate for a while later. If the market has been consolidating for a long time, it would begin trending real soon.
When we see a low percentile rank, no matter which line it is, this tells that the market hasn't been moving much, or there is little momentum. If the percentile rank stays below the median or even below the first quartile for a long time, this could suggest that the market is ready for the next trend since it has stored quite some energy.
When we see a high percentile rank, no matter which line it is, this tells that the market has been trending a lot, or there is much momentum. If the percentile rank stays above the median or even above the third quartile for a long time, it is probable that the market has used up much of its energy and is going to take a rest (consolidate).
- The percentile rank of the current value of the MACD line, displayed by the bright blue line.
- The percentile rank of the current value of the Signal line, displayed by the dark blue line.
- The percentile rank of the current value of the Histogram line, displayed by the olive histogram.
This indicator can be useful to identify the strength of trend. This indicator makes the assumption that market tends to revert into the opposite direction. If the market has been trending a lot, it should consolidate for a while later. If the market has been consolidating for a long time, it would begin trending real soon.
When we see a low percentile rank, no matter which line it is, this tells that the market hasn't been moving much, or there is little momentum. If the percentile rank stays below the median or even below the first quartile for a long time, this could suggest that the market is ready for the next trend since it has stored quite some energy.
When we see a high percentile rank, no matter which line it is, this tells that the market has been trending a lot, or there is much momentum. If the percentile rank stays above the median or even above the third quartile for a long time, it is probable that the market has used up much of its energy and is going to take a rest (consolidate).
Phát hành các Ghi chú
Update the picture of how the indicator should look.Mã nguồn mở
Theo đúng tinh thần TradingView, tác giả của tập lệnh này đã công bố nó dưới dạng mã nguồn mở, để các nhà giao dịch có thể xem xét và xác minh chức năng. Chúc mừng tác giả! Mặc dù bạn có thể sử dụng miễn phí, hãy nhớ rằng việc công bố lại mã phải tuân theo Nội quy.
Thông báo miễn trừ trách nhiệm
Thông tin và các ấn phẩm này không nhằm mục đích, và không cấu thành, lời khuyên hoặc khuyến nghị về tài chính, đầu tư, giao dịch hay các loại khác do TradingView cung cấp hoặc xác nhận. Đọc thêm tại Điều khoản Sử dụng.
Mã nguồn mở
Theo đúng tinh thần TradingView, tác giả của tập lệnh này đã công bố nó dưới dạng mã nguồn mở, để các nhà giao dịch có thể xem xét và xác minh chức năng. Chúc mừng tác giả! Mặc dù bạn có thể sử dụng miễn phí, hãy nhớ rằng việc công bố lại mã phải tuân theo Nội quy.
Thông báo miễn trừ trách nhiệm
Thông tin và các ấn phẩm này không nhằm mục đích, và không cấu thành, lời khuyên hoặc khuyến nghị về tài chính, đầu tư, giao dịch hay các loại khác do TradingView cung cấp hoặc xác nhận. Đọc thêm tại Điều khoản Sử dụng.