INVITE-ONLY SCRIPT
(12) Pass Band Muti VS-97

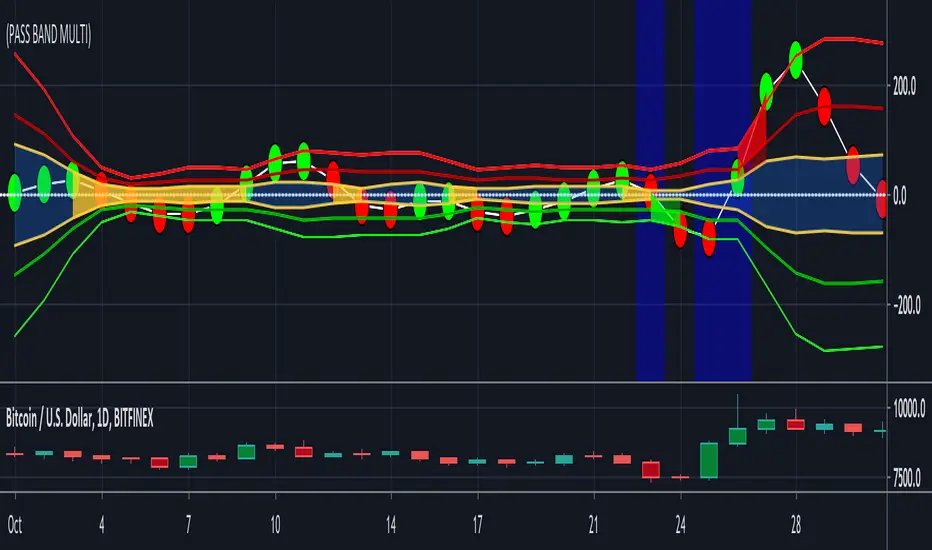
PBM transforms volatile and conflicting candles into obvious and easy trading decisions. It’s this simple; stocks trending in an upward direction will be above the zero line (1) in the chart below. Stock trending downward will be below the zero line (2). Zero line crossovers are indicating turning points and trading opportunities (3). This gives you advanced warning of when your trades are approaching the next turning point, as the indicator will migrate back toward the zero line. Momentum, Volatility and Rate-of-Change are each unique and distinctive attributes of stocks in strong trends. The Pass Band Multi indicator provides the trader with a collective or merged indication of these attributes, all reflected by this indicator as the height or distance the Pass Band, sin-wave, signal line is from the zero line (4).
When a stock’s PBM indicator advances rapidly, moving far above or far below the zero line you are seeing stocks in a strong trend with strong momentum. This strength and correspondingly the momentum will diminish over time in the absence of new market motivating factors such as rumors, news or earnings. As this occurs, the signal line will again drift down and approach the zero line even if the price has not moved against this most recent trend(5). This is a function of most oscillators and is referred to as detrending.
The closer your trade comes to the zero line the more likely you are to see a reversal in the stock's price in the near future. The PBM signal moving inside the center band (gold lines/blue fill)(6) indicates to you that this upward momentum has neutralized and an exit may be required as the stock’s price approaches the zero line. If you have a strong convection of this stock’s long term potential, then you can hold the stock as long as the Pass Band signal does not move below the zero line.
Stocks approaching the zero line, moving inside of the blue center band with gold boarders or tracking very near to the zero line indicate to traders that some action may be required by them to preserve capital in the near future. Short signals are exactly the opposite of the above description.
Over extended prices are signaled by green or red background flags and periods of consolidation are flagged with gold a background color.
Pass Band Multi is an excellent indicator for any class of equity, but as you can see from the example chart, it is also an excellent crypto trading indicator.
Access this Genie indicator for your Tradingview account, through our web site. (Links Below) This will provide you with additional educational information and reference articles, videos, input and setting options and trading strategies this indicator excels in.
Tập lệnh chỉ hiển thị cho người được mời
Quyền truy cập vào tập lệnh này bị hạn chế đối với người dùng được tác giả ủy quyền và thường yêu cầu thanh toán. Bạn có thể thêm nó vào mục yêu thích của mình, nhưng bạn sẽ chỉ có thể sử dụng nó sau khi yêu cầu sự cho phép từ tác giả. Liên hệ StockSwinger để thêm thông tin, hoặc làm theo hướng dẫn của tác giả bên dưới.
TradingView gợi ý bạn không trả tiền để sử dụng tập lệnh trừ khi bạn tin tưởng 100% vào tác giả của tập lệnh và hiểu cách hoạt động của tập lệnh. Trong nhiều trường hợp, bạn có thể tìm thấy giải pháp thay thế nguồn mở tốt miễn phí trong Tập lệnh cộng đồng của chúng tôi.
Hướng dẫn của tác giả
″
Bạn muốn sử dụng tập lệnh này trên biểu đồ?
Cảnh báo: vui lòng đọc trước khi yêu cầu quyền truy cập.
Thông báo miễn trừ trách nhiệm
Thông tin và ấn phẩm không có nghĩa là và không cấu thành, tài chính, đầu tư, kinh doanh, hoặc các loại lời khuyên hoặc khuyến nghị khác được cung cấp hoặc xác nhận bởi TradingView. Đọc thêm trong Điều khoản sử dụng.